Medical life-saving techniques include mechanical ventilation. During the COVID-19 epidemic, the lack of inexpensive, precise, and accessible mechanical ventilation equipment was the biggest challenge. The global need exploded, especially in developing nations. Global researchers and engineers are developing inexpensive, portable medical ventilators. A simpler mechanical ventilator system with a realistic lungs model is simulated in this work. A systematic ventilation study is done using the dynamic simulation of the model. Simulation findings of various medical disorders are compared to standard data. The maximum lung pressure (Pmax) was 15.78 cmH2O for healthy lungs, 17.72 for cardiogenic pulmonary edema, 16.05 for pneumonia, 19.74 for acute respiratory distress syndrome (ARDS), 17.1 for AECOPD, 19.64 for asthma, and 15.09 for acute intracranial illnesses and head traumas. All were below 30 cmH2O, the average maximum pressure. The computed maximum tidal volume (TDVmax) is 0.5849 l, substantially lower than that of the healthy lungs (0.700 l). The pneumonia measurement was 0.4256 l, substantially lower than the typical 0.798 l. TDVmax was 0.3333 l for ARDS, lower than the usual 0.497 l. The computed TDVmax for AECOPD was 0.6084 l, lower than the normal 0.700 l. Asthma had a TDVmax of 0.4729 l, lower than the typical 0.798 l. In individuals with acute cerebral diseases and head traumas, TDVmax is 0.3511 l, lower than the typical 0.700 l. The results show the viability of the model as it performs accurately to the presented medical condition parameters. Further clinical trials are needed to assess the safety and reliability of the simulation model.
Patients who are diagnosed with COVID-19 suffer from a major drop in blood oxygen saturation and face difficulty breathing. Mechanical ventilation is a crucial procedure for providing respiratory support to individuals facing inconveniences in breathing by assisting the breathing or controlling the respiration.1 In severe COVID-19 individuals, thromboembolic consequences, such as deep venous thrombosis, pulmonary embolism (PE), and acute mesenteric ischemia (AMI), have been observed. Lung illness can cause respiratory failure in many ways. Depending on immunity, COVID-19 might induce mild to severe breathing issues. The virus enters the human body through the nose, mouth, and eyes. COVID-19 causes bilateral pneumonia. Fluid in the lungs limits oxygen intake and causes shortness of breath, which can lead to acute respiratory distress syndrome (ARDS) and sepsis. Mechanical ventilation can help with breathing problems.2
Modern hospital ventilators are highly functional and technologically advanced, but in resource-limited health systems, they are very expensive.3 Severe Acute Respiratory Syndrome (SARS) caused by microcirculation thrombotic events promotes severe hypoxemia and multiple-organ dysfunction in patients with this disease.4 Mechanical ventilators are life support devices for patients in intensive care units (ICUs) who need assistance with ventilation diseases, trauma, congenital malformations, drug interactions, or surgical emergencies. However, the current need for respiratory mechanical ventilation due to COVID-19 outweighs the ability of health systems worldwide to obtain and deliver mechanical ventilators.5
Mechanical ventilation through modern mechanical ventilators is carried out in different modes. Modes of mechanical ventilation are widely discussed in Refs. 6 and 7. The present study is mainly focused on controlled modes, which can be divided into VCV (volume-controlled ventilation) and PCV (pressure-controlled ventilation). The most important advantage of minute-based ventilation is that it keeps the waveforms stable. VCV mode requires setting tidal volume, minute respiratory rate, inspiration-to-expiration (I/E) ratio, positive end-expiratory pressure (PEEP), and FiO2. PCV mode requires setting PiO2, minute respiratory rate, I/E ratio, PEEP, and FiO2. A VCV breath is a tidal volume delivered to the lungs. After a set tidal volume, the ventilator cycles. Flow rate determines inspiratory time. Lung pressures—peak inspiratory pressures (PIPs) and end-inspiratory alveolar pressures—depend on respiratory system resistance, compliance, and tidal volume. Controlling tidal volume and minute ventilation is the main benefit of VC, but in cases of impaired respiratory system compliance, it may cause dangerously high airway pressures and barotrauma. PCV uses airway pressure to expand the lungs for a set time. The clinician sets the inspiratory pressure, while dynamic lung compliance and airway resistance determine the delivered tidal volume and flow rate. After an inspiratory time, the ventilator stops delivering pressure. Controlling lung pressure prevents barotrauma. In intubated patients with high respiratory drive, PCV may improve ventilator synchrony because inspiratory flow is not fixed. PCV’s inability to guarantee or limit tidal volume due to acute lung compliance changes is a major drawback.8
In this uncertain situation, many researchers and engineers are actively participating to design a ventilator that can be produced by any suitable manufacturing facility. A plastic air tank, two wooden or plastic circles, a bendable wire, two check valves, a DC motor, and a guide cylinder were used in El Majid et al.’s9 design. The motor bends the wire and pulls the bottom circle up, squeezing the tank’s air. Through the check valve, the compressed air enters pipes. This is the inspiration stage of breathing. Since the patient’s lungs have a higher pressure than the air tank, the device will draw air from them. This is the expiration state. Low-cost embedded boards, such as Arduinos or ESP32s, will control the components. Although still in development, this concept offers a promising and affordable alternative to mechanical ventilation.
The RapidVent group and Northwell Health have figured out a way to transform a non-invasive BiPAP machine into an invasive ventilator for COVID patients.10 The researchers also invented a low-cost Brazilian emergency mechanical ventilator called 10D-EMV.11 The simulation model in this study was inspired by “Manshema,” a doctor-scientist-developed emergency ventilation machine. The model was based on MathWorks® “Medical Ventilator with Lung Model” and altered to classify the mechanical ventilator design, control method, and autonomously breathing patients. The Manshema Ventilator helps autonomously breathing patients maintain PEEP and blood oxygen saturation.12 A compact mechanical ventilator was created by automating bag-valve-mask (BVM) ventilation. Those projects used cam mechanisms, mechanical arms, and servo motors to move the BVM. Barotrauma from this cheap and easy design may damage the patient’s lungs. Robotic mechanisms squeeze and release the Ambu bag, but they cannot accurately control inspiration pressure.13,14
Researchers attempted cost savings in similar ways. Modifying the bag-valve-mask (BVM) with a ventilation rate alarm system and comparing it to conventional BVMs maximized minute ventilation volume delivery.15 In a simulation model, Culbreth and Gardenhire examined RT manual ventilation performance. Ninety-eight respiratory therapists were taught to ventilate a BVM manikin for 18 breaths. Therapists with more confidence provided higher peak pressures and flow rates. Thus, BVM ventilation may injure the patient’s lungs, emphasizing the need for an intervention to just provide safe and effective manual ventilation.16 Many emergency mechanical ventilator designs were also proposed based on mechanism, shape, cost, accessibility, novel sensors, and actuators.17–20 Complex ventilator designs were also manufactured by some researchers using 3-D printing technology.21,22
Guler et al. created a closed-loop intelligent mechanical ventilator using LabVIEW® to monitor and maintain respiratory variables to reduce clinician’s burden. The performance of device was tested with eight female Wistar albino rats using pressure-controlled ventilation.23,24 The present study standardized the mechanical ventilator design using these studies.23,24 To improve student learning, Guler and Ata created an instructional mechanical ventilator set. The training dataset controls inspiration and expiration valves and evaluates pressure sensors.25 Kato et al. studied trait–respiratory variable relationships. They examined silent breathing patterns.26
In volume control ventilation, preliminary ventilator configurations involve tidal volume, method of ventilation, plateau pressure, peak inspiratory pressure, and set inspiratory pressure. In pressure control ventilation, input parameters include set respiration rate, actual respirations, PEEP, and FiO2.27 Volume-targeted ventilation and pressure-targeted ventilation are used for patients on volume control and pressure-release volume control.
A recent article reviewed gas exchange monitoring during artificial ventilation.28 Avoiding volutrauma and barotrauma from uncorrected ventilation is crucial. Thus, flow meters are essential for accurately measuring patient gas exchange volumes. Accurate monitoring of flow rate and volume exchanges is also essential to minimize ventilator-induced lung injury (VILI). Mechanical ventilators use flowmeters to estimate patient gas delivery using the flow signal as input to adjust gas delivery. Flow meters must meet strict static or dynamic criteria because of their importance.29 Thus, mechanical ventilators use linear pneumotachographs, variable and fixed cost orifice meters, hot wire anemometers, and ultrasonic flow meters. Micromachined and fiber optic flow meter research is growing.30 Some studies have shown that flowmeters with high sensitivity, low pneumatic resistance, compact size, bi-directional features, and immunity from electromagnetic interference can give more accurate results and lead to concise choices.31
Mechanical ventilation requires many simultaneous operations and is delicate. Proper planning and monitoring of all operating parameters is essential. Mechanical ventilator mismanagement during initial ventilation can also harm patients. Tidal volume, ventilation rate, IE ratio, and PEEP are simultaneously adjusted to manage oxygenation. VILI occurs in 2.9% of artificially ventilated patients and usually causes pneumonia, lifelong lung bruising, and organ failure.32 To decrease VILI risk and ensure arterial oxygen supply and acid–base balance, these ventilator settings must be optimized.33 Mathematical simulation can help us understand organ and organism-level procedures and translate scattered knowledge into medically applicable effective treatments.
Mechanical ventilation in ARDS patients is risky. A poorly set mechanical breath can worsen ARDS-related lung injury, causing supplementary ventilator-induced lung injury. Mechanical ventilation reduces VILI and ARDS mortality.34 PEEP could be adapted to physiologic variables, usually oxygenation. Dead space, lung stress, lung compliance, and strain; ventilation trends using Computed Tomography (CT) or Electrical impedance tomography (EIT); inflection marks on the pressure/volume curve (P/V); and the expiratory flow curve slope utilizing airway pressure release ventilation (APRV) have, indeed, been tested to personalize PEEP.35 Personalizing PEEP helps ventilator settings match lungs’ pathophysiology. Novel PEEP personalization uses the expiratory flow trend during APRV.36 Expiratory duration adjusts with acute lung injury. Intrinsic PEEP stabilizes the lungs during short expiration.37
Guideline-based ventilator weaning reduces ventilator-associated pneumonia (VAP) and ICU length of stay. VAP is usually diagnosed by infection control specialists. Guideline-based weaning lessens mechanical ventilation and VAP risk. Complications drop significantly in wounded and general surgical patients, but ICU length depends on medical system resources. Because of the prolonged respiratory care, ICU discharge of the patient was often delayed. VAP and impromptu reintubation are reduced along with mechanical ventilation use. Injury and general surgery patients benefit the most from the implementation of this procedure.38,39 Mechanical ventilator simulation and mathematical modeling research by Refs. 40–42 was also perceived.
Using MATLAB®, SimscapeTM, and Simulink® tools, this study attempts to develop a physiological simulation model that describes the allocation of airflow and oxygenation in the lungs of healthy individuals and medically ill patients with ventilation issues. A simple clinical ventilator system with a real-world lungs model and patient–ventilator synchronization is simulated in this study. Mathematical modeling is used to present a system using just a mathematical concept. Computational software packages, such as MATLAB, Simscape, and LabVIEW, make it easy to study mathematical models and simulate them under varying conditions.
Biomedical engineering relies on modeling and simulation, especially respiratory system models, which save lives. This study successfully simulated a pressure-controlled ventilator. The simulations were carried out for different test cases, which include healthy human lungs (normal lungs model); hypoxemic respiratory failure, including cardiogenic pulmonary edema (CPE), pneumonia (without ARDS), and ARDS; hypercapnic respiratory failure for obstructive lung disease, including acute exacerbation of COPD (AECOPD) and asthma; and hypercapnic respiratory failure for acute intracranial disorders and head injuries with elevated intracranial pressure (ICP). The process for creating the mechanical ventilation model is covered in detail in Sec. II, Methodology. In Sec. III, results and discussion, the simulation parameter settings, model output for various test cases, and correlation with standard data are reviewed. A computational model of a medical ventilator and a patient's respiratory system is used in Sec. IV, or the conclusion, to demonstrate the importance of mathematical modeling in biomedical research.
In the present study, MathWorks MATLAB and Simulink Simscape are used to create the simulation model for the mechanical ventilator. The software aids in developing a system-design platform to predict the outcome of the project with a better visualization and accuracy without bringing the prototype into actual existence and helps in avoiding the risk of a patient’s life for experimental purposes. Simulink has a vast collection of tools on Simscape to create the simulation model in domains such as electrical, gas, hydraulics, and moist air. This model is created in the moist air domain. A reservoir block is used as a source of oxygen and air. A pulse generator block is used for performing the breathing cycles. To monitor the system, sensor blocks, such as volumetric flow rate sensors, pressure and temperature sensors, and ideal translational motion sensors, are used. The scope block is used to plot the data measured by sensors. Furthermore, to control pressure, volume, flow, etc., tools such as controlled pressure sources, controlled volumetric flow rate sources, and local restrictions are used.
where T1 is the muscle contraction time and Ttot is the breathing cycle length. Pmax is the maximum muscle-induced pressure, and τc and τr are the contraction and relaxation time constants.
FIG. 2.
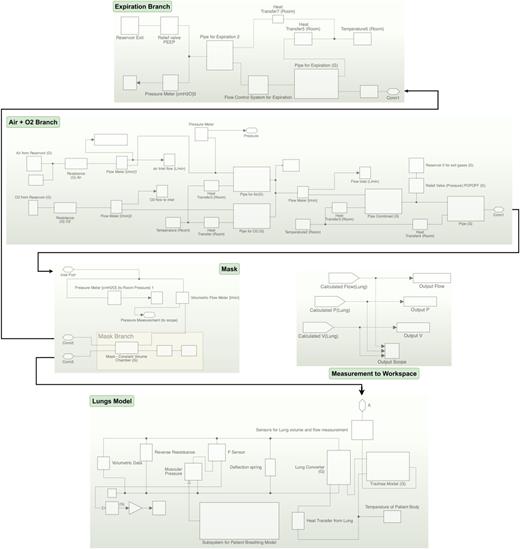
Simulink model of mechanical ventilator.
While developing the MathWorks MATLAB and Simulink Simscape mechanical ventilation simulation model, several assumptions and limitations were taken into account. The first assumption was that all the sensors, actuators, and controllers are ideal components in MATLAB. However, in real, these components are not ideal and possess some degree of error or limitation. The second supposition is that the Simulink model might take steady-state circumstances for granted and ignore the transient effects that occur when the mechanical ventilation system starts and stops. This may have an effect on how well the ventilation system operates. In addition, the model may disregard the real-time variation of temperature, humidity, and density in the atmosphere by assuming that these parameters are constant. Whenever there is a relationship between the environment and the ventilation model components, this was mostly taken into consideration when constructing the model. The model may also imply that, unlike other electrical systems, it functions as an isolated system and does not interact with external disturbances.
The simulation model for the mechanical ventilation system will have certain limitations because it is based on assumptions. There may be differences between the system conditions that are modeled and the actual system conditions since the correctness of the model is dependent on the underlying mathematical equations and assumptions. In addition, the model will fall short in capturing the nonlinearities and delays that are inherent in the response of sensors and actuators. The performance and response time of the system may be impacted by this. Model simplification is frequently done to increase computational efficiency, but it can have an adverse effect on accuracy by leaving out important aspects of the physical phenomenon. In certain instances, it is possible that the model oversimplified control methods rather than accurately capturing the intricacies of actual control systems. It is possible that any parameter variability was omitted, which could have an impact on the model’s performance. Although all safety precautions were taken, such as fail-safe valves and real-time gas exit to the atmosphere or reservoir, the model may not fully account for all real-world scenarios that could arise during actual operation. Therefore, additional testing of the model in real-world scenarios is necessary to avoid these limitations and close any gaps.
For simulation purposes, the predicted body weight (PBW) and tidal volume of the patient are taken from the NHLBI ARDS Network (available at www.ardsnet.org/). The PBW is taken as 70 kg, and the corresponding tidal volumes are referred to for the validation of the model.
ARDS is a serious lung injury with several causes. It is commonly linked to sepsis and multi-organ failure, and it is associated with increased mortality. ARDS induces diffuse alveolar injury, pulmonary micro-vascular thrombus formation, inflammatory cell collation, and blood flow stagnation. Hypoxemia and increased respiratory work typify ARDS. PEEP, high FiO2, and lowered breathing work alter hypoxemia. Often, these ARDS issues require MV. MV has been detrimental for five decades. Ventilators were adjusted to stabilize blood gas values in the late 1960s. Healthcare professionals used a TDV of 12–15 ml/kg of body weight.60 In serious ARDS, 90% of deaths occurred from pneumothorax, pneumomediastinum, and pneumoperitoneum.61 Amato and colleagues62 and the ARDSNet (Acute Respiratory Distress Syndrome Network)63 trial conducted in the year 2000 indicated that low TDV ventilation [4–6 ml/kg Ideal Body Weight (IBW)] seemed to be better than higher TDV ventilation (10–12 ml/kg IBW). IBW anticipates lung capacity better than weight. Recent progress in the VILI investigation has rekindled interest in lung protective ventilation strategies (LPVS).64 Recent evidence indicates that reducing the tidal volume in patients without ARDS could be beneficial.65–68
Four main theories describe ventilator-induced lung injury: barotrauma, volutrauma, atelectrauma, and biotrauma.65 High airway pressure causes lung barotrauma (i.e., pneumothorax or pneumomediastinum). High-TV-induced volutrauma produces alveoli overdistribution. Atelectrauma is caused by shear and strain of retractable lung units opening and closing, and biotrauma is caused by proinflammatory cytokines and immune-mediated damage from unphysiologic stress or strain.64 LPVS focus on limiting tidal volume, end-inspiratory plateau pressure (Pplat), PEEP, and FiO2.68 MV patients without ARDS have no optimal TDV.68–70 Mammalian TDV is 6.3 ml/kg.71 ARDSNet63 and other trials65–67 imply that TDV exceeding 10 ml/kg IBW is injurious. In cardiac surgery patients, a TDV less than 10 ml/kg IBW reduced organ failure and ICU length of stay (LOS), according to Lellouche and colleagues.65 A reduced intra-operative TDV (6–8 ml/kg IBW) after abdominal surgery lowered postoperative ventilatory support, pneumonia, and hospital LOS in the IMPROVE66 study group. LPVS and low TDV require high RR to retain Vm. By taking the above data into account, the input parameters provided to the model are listed in Table VII. The output obtained from the model simulation is listed in Table VIII.
Input parameters for the model.
| Ventilation strategies | Disease/condition | RR | P01 | PEEP | IPAP | EPAP |
|---|---|---|---|---|---|---|
| Breaths/min | cmH2O | cmH2O | cmH2O | cmH2O | ||
| Hypoxemic respiratory failure | ARDS | 27 | 4.5 | 12 | 15 | 8 |
| Ventilation strategies | Disease/condition | RR | P01 | PEEP | IPAP | EPAP |
|---|---|---|---|---|---|---|
| Breaths/min | cmH2O | cmH2O | cmH2O | cmH2O | ||
| Hypoxemic respiratory failure | ARDS | 27 | 4.5 | 12 | 15 | 8 |
Output parameters obtained from the model.
| Ventilation strategies | Disease/condition | Pmax | Vmax | Fmax | TDVmax |
|---|---|---|---|---|---|
| cmH2O | l | l/min | l | ||
| Hypoxemic respiratory failure | ARDS | 19.74 | 3.995 | 32.21 | 0.3333 |
| Ventilation strategies | Disease/condition | Pmax | Vmax | Fmax | TDVmax |
|---|---|---|---|---|---|
| cmH2O | l | l/min | l | ||
| Hypoxemic respiratory failure | ARDS | 19.74 | 3.995 | 32.21 | 0.3333 |
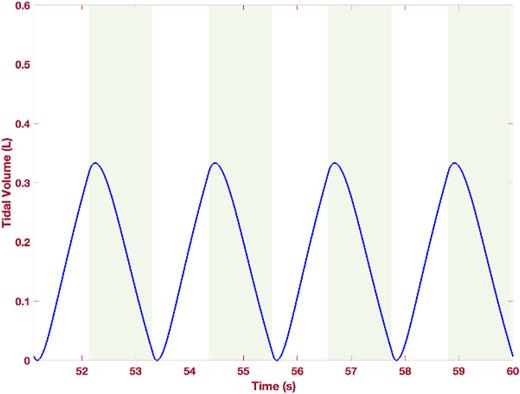
LPVS limit airway pressure to avoid barotrauma. Pplat estimates alveolar pressure throughout inspiration. Preventing airflow after inspiration achieves this. No Pplat is safe. Pplat must be under 30 cmH2O in ARDS. Hager and colleagues72 found that lower Pplat values improved ARDSNet outcomes. PEEP configuration and selection methods are debated.73,74 The validated and easy-to-use ARDSNet PEEP table75 is recommended for ED management.73 So, PEEP and FiO2 are provided to the model according to these data. An Fmax of 32.21 l/min is obtained during the simulation, which can be observed in Fig. 15. The pressure variation is shown in Fig. 16, where a Pmax of 19.74 cmH2O is obtained, which is less than the Pplat pressure limit for an ARDS patient. From Fig. 17, a TDVmax of 0.3333 l is obtained, which is a low tidal volume and specifically suitable for ARDS patients.
FIG. 15.
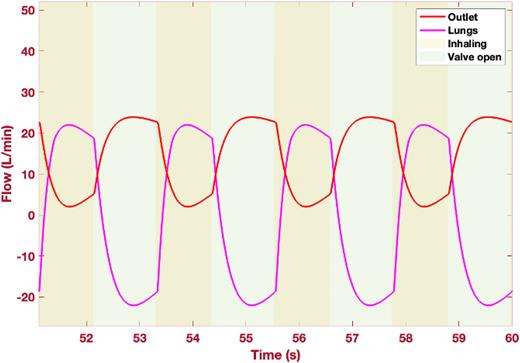
Flow of outlet and lungs (l/min) vs time (s).
FIG. 16.
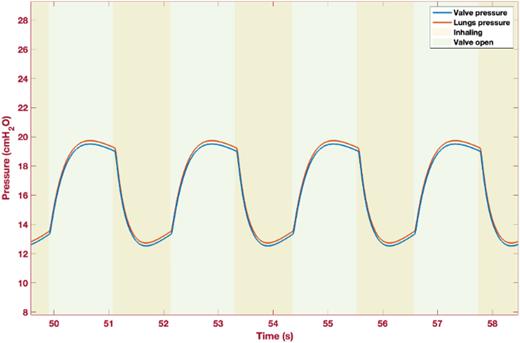
Valve and lung pressure (cmH2O) vs time (s).
In Fig. 18, the variation of the overall flow rate, lung pressure, and lung volume during the total simulation time is presented. A gradual increase in pressure and variation of the built-up volume as per the flow rate can be predominantly observed in the figure.
FIG. 18.
Flow (l/min), pressure (cmH2O), and volume (l) vs simulation time (s).
COPD patients’ airway function and respiratory symptoms worsen suddenly during acute exacerbations (AECOPD). Such exacerbations could, indeed, range from self-limiting diseases to florid respiratory failure, mandating mechanical ventilation. The average COPD patient has two such episodes per year, which use a myriad of medical resources.76 Viral diseases and environmental factors can also cause AECOPD. AECOPD episodes can be sparked or complicated by other comorbid conditions, such as cardiovascular disease, other lung diseases (e.g., pulmonary emboli, aspiration, pneumothorax), or systemic processes. In most patients, antibiotics, corticosteroids, and bronchodilators are prescribed. Certain patients may benefit from oxygen, physical therapy, mucolytics, and airway clearance devices.77
Non-invasive positive pressure ventilation may delay endotracheal intubation in hypercapnic respiratory failure. Invasive mechanical ventilation should avoid ventilator-induced lung injury and reduce inherent positive end-expiratory pressure. For these instances, restrict breathing by limiting the ventilation and allow hypercapnia. Mild AECOPD is usually reversible, but serious breathing failure is linked to high mortality and long-term impairment.78 PCV or VCV can be used. Setting rate and inspiratory time makes PCV better than pressure support ventilation (PSV). PCV’s patient-demand-driven flow is an advantage. PCV reduces tidal volume with increased auto-PEEP. With VCV, tidal volume does not decrease with increased auto-PEEP, but there is a risk of increased plateau pressure and overdistention. By taking the above data into consideration, the input parameters for the model are derived and tabulated in Table IX. The resulting output from the model is listed in Table X.
Input parameters for the model.
| Ventilation strategies | Disease/condition | RR | P01 | PEEP | IPAP | EPAP |
|---|---|---|---|---|---|---|
| Breaths/min | cmH2O | cmH2O | cmH2O | cmH2O | ||
| Hypercapnic | Obstructive lung disease | 12 | 4.1 | 6 | 14.3 | 6 |
| respiratory failure | (acute exacerbation of COPD) |
| Ventilation strategies | Disease/condition | RR | P01 | PEEP | IPAP | EPAP |
|---|---|---|---|---|---|---|
| Breaths/min | cmH2O | cmH2O | cmH2O | cmH2O | ||
| Hypercapnic | Obstructive lung disease | 12 | 4.1 | 6 | 14.3 | 6 |
| respiratory failure | (acute exacerbation of COPD) |
Output parameters obtained from the model.
| Ventilation strategies | Disease/condition | Pmax | Vmax | Fmax | TDVmax |
|---|---|---|---|---|---|
| cmH2O | l | l/min | l | ||
| Hypercapnic respiratory | Obstructive lung disease | 17.1 | 3.841 | 32.11 | 0.6084 |
| failure | (acute exacerbation of COPD) |
| Ventilation strategies | Disease/condition | Pmax | Vmax | Fmax | TDVmax |
|---|---|---|---|---|---|
| cmH2O | l | l/min | l | ||
| Hypercapnic respiratory | Obstructive lung disease | 17.1 | 3.841 | 32.11 | 0.6084 |
| failure | (acute exacerbation of COPD) |
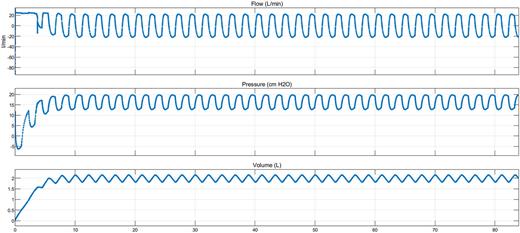
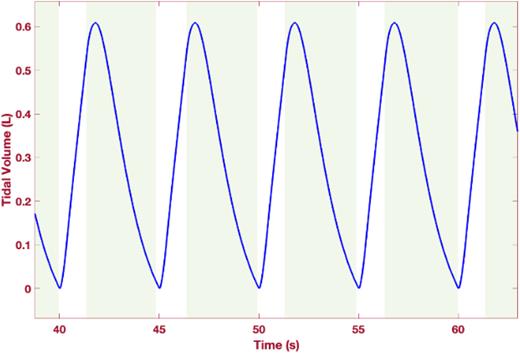
From Fig. 19, it is observed that the flow rate particularly drops when the outlet valve opens and rises at the start of the inhalation process. From Fig. 20, a lung peak pressure, Pmax, of 17.1 cmH2O is observed, which is particularly safe as it is less than the safe limit of ≤30 cmH2O.79 A TDVmax value of 0.6084 l is obtained from the model as shown in Fig. 21. By making the PEEP higher, the tidal volume can be cut down even more.
FIG. 19.
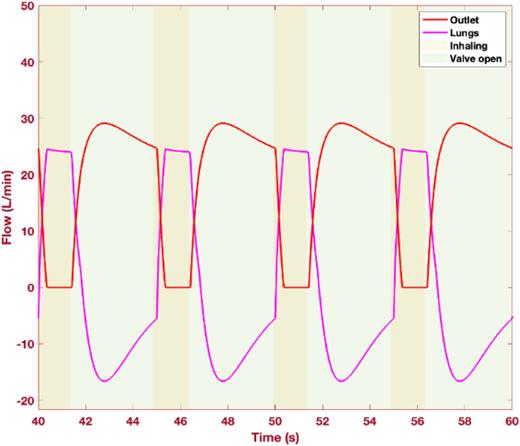
Flow of outlet and lungs (l/min) vs time (s).
FIG. 20.
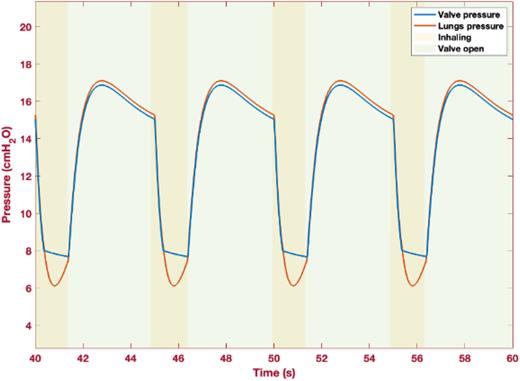
Valve and lung pressure (cmH2O) vs time (s).
The variation of the overall flow rate, lung pressure, and lung volume during the total simulation time is presented in Fig. 22. A gradual increase in pressure and variation of the built-up volume as per the flow rate can be predominantly observed in the figure.
FIG. 22.
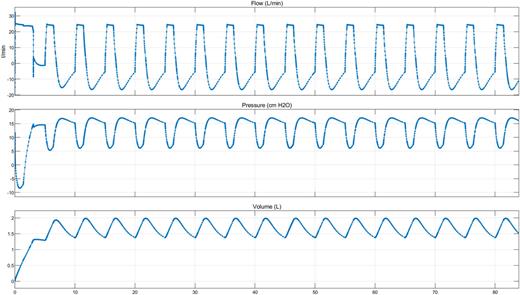
Flow (l/min), pressure (cmH2O), and volume (l) vs simulation time (s).
A person is said to have hypercapnic respiratory failure if their PaCO2 is higher than 45 mmHg and their PaO2 is lower than 60 mmHg. With asthma, it can be hard to tell when regular treatment has not worked and extra help with breathing is needed. Many people with severe asthma are young and fit otherwise, and they can still breathe even though they have to work much harder to do so.80–82 These people can keep their PaCO2 below or equal to 40 mmHg until they have been completely worn out. When CO2 is kept inside the body, serious hypercapnia and acidosis can happen quickly. So, mechanical ventilation can be used when PaCO2 is higher than 40 mmHg, or sooner if the patient shows signs of being tired. At this point, the patient is growing tired, and waiting longer to start ventilation causes even less air to get into the lungs.82 Auto-positive end-expiratory pressure and air trapping happen in individuals with serious acute asthma (auto-PEEP). The air gets stuck because bronchospasm, inflammation, and secretions make the airways less flexible. The large changes in intrathoracic pressure during the breathing cycle are caused by the auto-PEEP and the increased resistive load. This is called pulsus paradoxus. Either VCV or PCV can be used, but at the start of respiratory support, VCV is often needed. Due to the high resistance in the airways, people with very acute asthma need a high driving pressure to get the tidal volume.83,84
Once the asthma severity improves, the patient can be transitioned to PCV per the clinician’s bias. With PCV, changes in the delivered tidal volume at a fixed pressure are a reflection of changes in resistance and air trapping. As the severity of the asthma improves, the delivery of TDV with PCV increases. To minimize the development of auto-PEEP, a small TDV (4–6 ml/kg) should be used. The tidal volume must be selected so that the pressure at the plateau is less than 30 cmH2O. The threshold of pulmonary congestion and auto-PEEP should be used to decide how fast a person should breathe. In theory, a lower rate makes air trapping less likely. However, in some asthma patients, the rate can be raised to 15–20 breaths per min without the need for a big change in auto-PEEP. CO2 stays in the body when the tidal volume is low and the rate is slow. Most of the time, it is enough to keep the pH at 7.20 or higher. Even a lower pH may be fine for young asthmatics who are otherwise healthy. Most of the time, the risk of auto-PEEP, lung damage, and low blood pressure is higher than the risk of acidosis.84 Whether or not PEEP should be used to treat asthma is a point of debate. In asthma, auto-PEEP is not usually caused by a lack of airflow as it is in COPD. If flow is not limited, adding PEEP may not be able to counterbalance auto-PEEP, but it may instead raise alveolar pressure.85 In addition, the advantage of PEEP in the case of auto-PEEP might be brought into question if the patient is getting full ventilation and is not trying to wake up the machine. When PEEP is used, lung units that do not make their own auto-PEEP may be recruited and stabilized, which could make the way air moves through the body better. Patients with acute asthma should not be given PEEP if it leads to a rise in plateau pressure and total PEEP.86 If PEEP is used in this situation, gas exchange, auto-PEEP, plateau pressure, and the way the heart works must be watched. Taking the above things into consideration, the input parameters for simulating the model are presented in Table XI. The output from the simulation model is shown in Table XII.
Input parameters for the model.
| Ventilation strategies | Disease/condition | RR | P01 | PEEP | IPAP | EPAP |
|---|---|---|---|---|---|---|
| Breaths/min | cmH2O | cmH2O | cmH2O | cmH2O | ||
| Hypercapnic respiratory | Obstructive lung | 17 | 4.8 | 11 | 14.3 | 5 |
| failure | disease (asthma) |
| Ventilation strategies | Disease/condition | RR | P01 | PEEP | IPAP | EPAP |
|---|---|---|---|---|---|---|
| Breaths/min | cmH2O | cmH2O | cmH2O | cmH2O | ||
| Hypercapnic respiratory | Obstructive lung | 17 | 4.8 | 11 | 14.3 | 5 |
| failure | disease (asthma) |
Output parameters obtained from the model.
| Ventilation strategies | Disease/condition | Pmax | Vmax | Fmax | TDVmax |
|---|---|---|---|---|---|
| cmH2O | l | l/min | l | ||
| Hypercapnic respiratory | Obstructive lung disease | 19.64 | 4.051 | 32.52 | 0.4729 |
| failure | (asthma) |
| Ventilation strategies | Disease/condition | Pmax | Vmax | Fmax | TDVmax |
|---|---|---|---|---|---|
| cmH2O | l | l/min | l | ||
| Hypercapnic respiratory | Obstructive lung disease | 19.64 | 4.051 | 32.52 | 0.4729 |
| failure | (asthma) |
The flow rate variation is shown in Fig. 23. From the figure, it is observed that the flow rate is low as per the respiratory rate of the patient and is suitable for the said respiratory condition, as discussed previously. From Fig. 24, a Pmax of 19.64 cmH2O is observed, which is sufficiently less than the recommended safe pressure for acute asthmatic patients. The plateau pressure is also within the safe ≤30 cmH2O limit.86 The PCV mode is utilized here to simulate the model. The tidal volume variation obtained from the model, as shown in Fig. 25, can be utilized by the clinician as one of the parameters for determining the severity of the patient. A TDVmax of 0.4729 l is obtained, which is suitable as per the input parameters provided to the patient.86
FIG. 23.
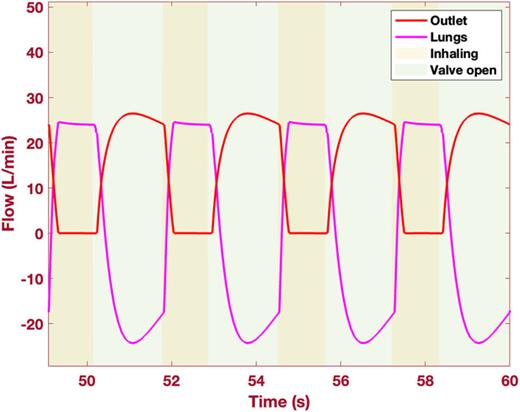
Flow of outlet and lungs (l/min) vs time (s).
FIG. 24.
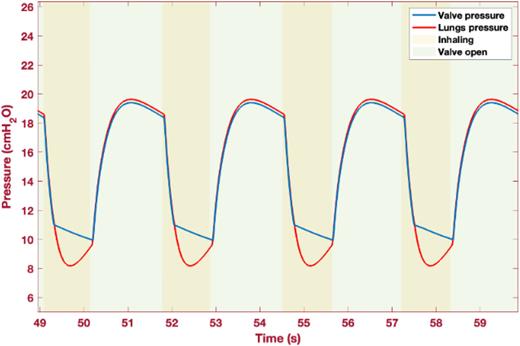
Valve and lung pressure (cmH2O) vs time (s).
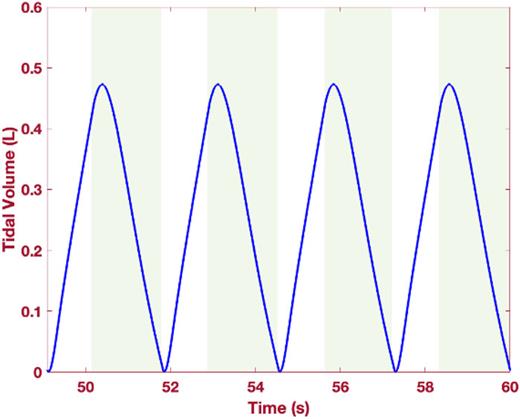
In Fig. 26, the variation of the overall flow rate, lung pressure, and lung volume during the total simulation time is presented. A gradual increase in pressure and variation of the built-up volume as per the flow rate can be predominantly observed in the figure.
FIG. 26.
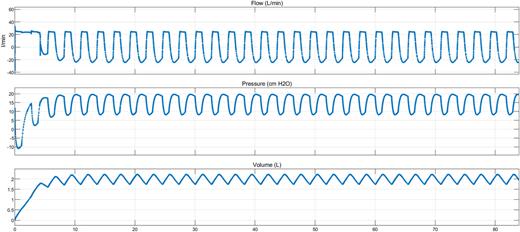
Flow (l/min), pressure (cmH2O), and volume (l) vs simulation time (s).
Most of the time, central respiratory depression causes people with head injuries to need mechanical ventilation. ICP goes up when the amount of fluid in the brain goes up because the skull is rigid. Even though a slight increase in the intracranial volume does not cause ICP to rise, ICP goes up a lot when the intracranial volume goes up a lot. This rise in ICP cuts off blood flow to the brain, which leads to a lack of oxygen in the brain. When the ICP goes up a lot, the brain starts to swell and pushes through the tentorium. This puts pressure on the brain stem. Controlling ICP is a big part of how head injuries are treated. The difference between the mean arterial pressure (MAP) and the intracranial pressure (ICP) is called the cerebral perfusion pressure (CPP): CPP = MAP − ICP.
The normal CPP is greater than 80 mmHg because ICP is less than 10 mmHg and MAP is equal to 90 mmHg. The goal CPP is between 50 and 70 mmHg. CPP should not be less than 50 mm Hg. When someone has a head injury, the ICP is often measured. Either a drop in MAP or a rise in ICP will cause CPP to go down. Because of the higher intrathoracic pressure that comes with mechanical ventilation, ICP can go up and CPP can go down. PEEP could cause MAP and venous return to go down. When venous return goes down, ICP goes up, and when MAP goes down, CPP goes down. Acute head injuries need both blood flow management and breathing management. Caution shall be exercised to avoid a high MAP, which can hurt CPP by lowering venous return (which causes ICP to rise) and lowering cardiac output (resulting in a decrease in MAP). When a patient has an ICP that is too high, the goal of ventilation is to get their oxygen levels and acid–base balance back to normal. When the pressure in the lungs goes up, the veins do not get as much blood back and the heart does not pump as much blood out.87
Most of the time, such patients need to be ventilated because the primary injury has caused their central breathing to slow down. In these cases, the lung function could be close to normal, and it is easy to use mechanical ventilation. When a person has a traumatic injury, they might have injuries to their chest, abdomen, or spine, meaning that they require mechanical ventilation. Because of neurogenic pulmonary edema, it may also be necessary to use positive pressure ventilation. Finally, some treatments for a severe head injury, such as barbiturates, sedation, and paralysis, slow down the central respiratory system. This makes mechanical ventilation necessary.88, Table XIII shows recommendations for the first settings of the ventilator for patients with head injuries. Oxygenation is probably not necessary for people with head injuries since their lungs usually work pretty well. At first, 100% oxygen is given to these patients, but pulse oximetry makes it easy to reduce the amount of oxygen quickly. Most of the time, a PEEP level of 5 cmH2O is a good starting point. Even though there are worries about how PEEP affects ICP, it usually does not hurt ICP at levels less than or equal to 10 cmH2O. Oxygenation is treated the same way for neurogenic pulmonary edema as for other types of ARDS, but caution must be exercised to prevent the effects of a high MAP on ICP. When a patient needs high levels of PEEP, the head of the bed must be lifted to lessen the effects of the enhanced intrathoracic pressure, and ICP should be watched carefully.89,90
Input parameters for the model.
| Ventilation strategies | Disease/condition | RR | P01 | PEEP | IPAP | EPAP |
|---|---|---|---|---|---|---|
| Breaths/min | cmH2O | cmH2O | cmH2O | cmH2O | ||
| Permissive | Acute intracranial disorders | 18 | 4 | 5 | 12 | 5 |
| hypercapnia | and head injuries |
| Ventilation strategies | Disease/condition | RR | P01 | PEEP | IPAP | EPAP |
|---|---|---|---|---|---|---|
| Breaths/min | cmH2O | cmH2O | cmH2O | cmH2O | ||
| Permissive | Acute intracranial disorders | 18 | 4 | 5 | 12 | 5 |
| hypercapnia | and head injuries |
The clinician’s personal preference determines whether volume-controlled ventilation or pressure-controlled ventilation is used. If the plateau pressure is kept below 30 cmH2O, a tidal volume of 6–8 ml/kg of ideal body weight can be used. Most of the time, this is not an issue since these patients have almost normal lung and chest wall compliance. If the patient has both short-term and long-term respiratory problems, the tidal volume is set lower. The right breathing rate must be selected to keep the acid–base balance in the body normal. Most of the time, this can be done by taking 15–25 breaths per min. The input parameters presented to the model based on the above data and the output from the model are listed in Tables XIII and XIV, respectively.
Output parameters obtained from the model.
| Ventilation strategies | Disease/condition | Pmax | Vmax | Fmax | TDVmax |
|---|---|---|---|---|---|
| cmH2O | l | l/min | l | ||
| Permissive | Acute intracranial disorders | 15.09 | 3.533 | 32.12 | 0.3511 |
| hypercapnia | and head injuries |
| Ventilation strategies | Disease/condition | Pmax | Vmax | Fmax | TDVmax |
|---|---|---|---|---|---|
| cmH2O | l | l/min | l | ||
| Permissive | Acute intracranial disorders | 15.09 | 3.533 | 32.12 | 0.3511 |
| hypercapnia | and head injuries |
The flow rate during the inhalation and exhalation processes of the patient is shown in Fig. 27. From the figure, it is observed that the flow rate is accurately following the breathing pattern of the patient. As recommended from the previous studies, the plateau pressure should be maintained below 30 cmH2O. Here, from Fig. 28, a maximum lung pressure (Pmax) of 15.09 cmH2O is observed, and the plateau pressure is well within the limit.91
FIG. 27.
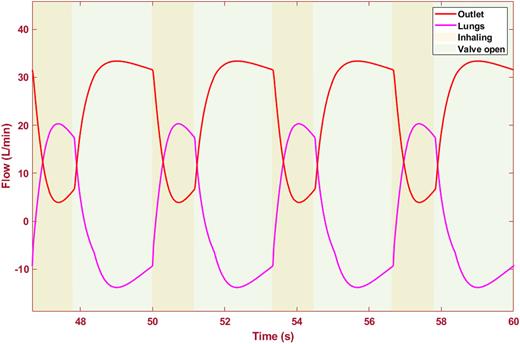
Flow of outlet and lungs (l/min) vs time (s).
FIG. 28.
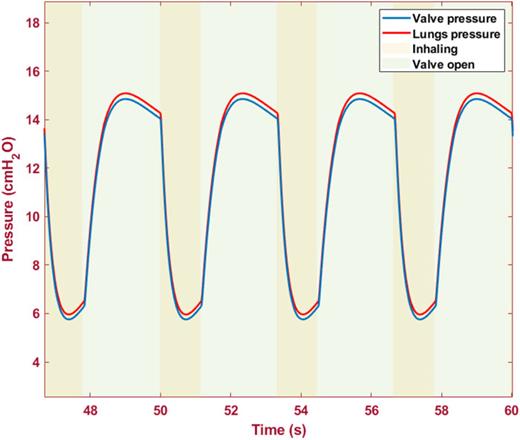
Valve and lung pressure (cmH2O) vs time (s).
The maximum tidal volume (TDVmax) from Fig. 29 is observed to be 0.3511 l, which is considered a low tidal volume and generally recommended for elevated ICP patients. The tidal volume curve shows no significant deflection from the ideal TDV curve.
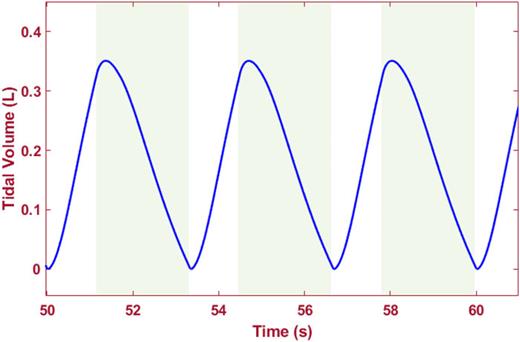
In Fig. 30, the variation of the overall flow rate, lung pressure, and lung volume during the total simulation time is shown. As visible from the figure, at the onset of breathing, the solenoid valve opens, and due to the high flow rate, a corresponding pressure drop and an increase in volume are observed.
FIG. 30.
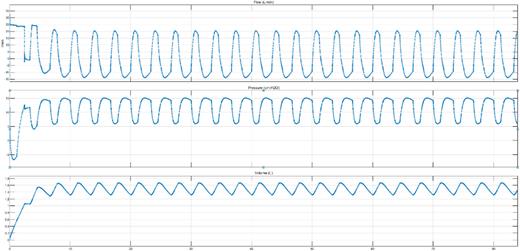
Flow (l/min), pressure (cmH2O), and volume (l) vs simulation time (s).
In the present study, a simulation model is presented for the bulk of the individually built ventilators developed globally in response to the COVID‐19 issue. MATLAB/Simulink, a program for computational modeling, is used to develop a simulation model of mechanical ventilation systems. An examination of the operation of a mechanical ventilator can be conducted using the suggested simulation model. Through the Simulink interface, all model parameters can be monitored, and the data plots may be utilized to examine appropriate ventilation details. The model is used to test various medical conditions that require mechanical ventilation, such as hypoxemic respiratory failures, including cardiogenic pulmonary edema (CPE), pneumonia (without ARDS), and ARDS; hypercapnic respiratory failure due to obstructive lung diseases, including acute exacerbation of COPD (AECOPD) and asthma; and hypercapnic respiratory failure for acute intracranial disorders and head injuries with elevated intracranial pressure (ICP), and the simulation results showed a high degree of agreement with the commonly accessible data. Pmax was calculated to be 15.78 cmH2O for the healthy lungs case, which is much lower than the standard maximum value of 30 cmH2O. TDVmax was calculated to be 0.5849 l, which is much lower than the typical value of 0.700 l. In the case of cardiogenic pulmonary edema (CPE), a maximum pressure of 17.72 cmH2O is measured, which is lower than the typical maximum pressure of 30 cmH2O. The TDVmax of 0.5053 l is lower than the average TDVmax, which is 0.798 l. In the case of pneumonia, Pmax is calculated to be 16.05 cmH2O, which is significantly lower than the Pmax that is typical, which is 30 cmH2O. TDVmax was calculated to be 0.4256 l, which is much lower than the usual value of 0.798 l. The Pmax for the case of ARDS was determined to be 19.74 cmH2O, which is lower than the usual Pmax of 30 cmH2O. The value of 0.3333 l that was achieved for TDVmax is lower than the value of 0.497 l that is typically used for TDVmax. In the case of AECOPD, the maximum pressure measured was 17.1 cmH2O, which is lower than the typical maximum pressure of 30 cmH2O. In addition, the TDVmax that was calculated came out to be 0.6084 l, which is lower than the usual TDVmax value of 0.700 l. In the case of asthma, the maximum pressure measured was 19.64 cmH2O, which is lower than the typical maximum pressure of 30 cmH2O. In addition, the TDVmax that was calculated came out to be 0.4729 l, which is lower than the usual value of 0.798 l. The Pmax that was measured in patients with acute intracranial disorders and head injuries was 15.09 cmH2O, which is lower than the Pmax that is typically measured, which is 30 cmH2O. In addition, the TDVmax is lower than the normal value of 0.700 l, coming in at 0.3511 l. This validates the accuracy of the simulation model. Through the use of a realistic lung model and human response comparison, the simulation model provides an opportunity to assess the level of quality between the developed devices and the digital twin model. By better visualizing and accurately forecasting the results, this simulation model can aid in the prototype building of the real mechanical ventilator.