Table of Contents
1. Introduction
Through the analysis of the above studies, it is found that regular breathing training can improve the lung function and symptoms of dyspnea in people with breathing disorders. However, the breathing training process is monotonous and boring, and there are problems such as unquantified breathing data and poor feedback of breathing training results. The effect of the patient’s breathing training and the real-time breathing training data cannot be reflected in time.
With the development of virtual reality technology, people have introduced it into rehabilitation training. This study applies virtual reality technology combined with biofeedback to respiratory rehabilitation training to visualize respiratory training data and intuitively understand the effect of respiratory rehabilitation training. This system can not only improve users’ attention and enthusiasm for training, but also enable users to train efficiently and orderly through personal training tasks.
2. Related Work
2.1. Application of Virtual Reality Technology in Medical Field
In the above research, virtual reality technology can provide an immersive virtual scene, using the advantages of the virtual scene to make the originally boring content lively and interesting, and improve the enthusiasm and participation of participants. In the process of rehabilitation training, the patient’s attention is improved, mental stress is relieved, and the effect of rehabilitation training is improved.
2.2. Biofeedback Technology
3. System Architecture
In order to overcome the above obstacles, a biofeedback respiratory training rehabilitation system based on virtual reality technology is designed to improve the patient’s respiratory function and achieve visual biofeedback to obtain the patient’s own real-time respiratory training effects and data. The system is designed to be an intuitive and portable breathing training system that does not require expensive and heavy measurement sensors. A portable vital capacity sensor is used combined with HTC Vive pro2 VR equipment to form a respiratory rehabilitation training system that uses respiratory data to drive virtual scene changes. The respiratory training effect is presented in the form of visual feedback in biofeedback. This paper provides an overview of the designed respiratory rehabilitation training system and conducts an empirical evaluation of its experience and training effects.
3.1. System Framework Structure
3.2. Hardware Equipment
The respiratory data sensor mainly collects respiratory signals and transmits the data to the PC in real time, which is used as a basis for judging the effect of rehabilitation training. The head-mounted display maps the virtual scene onto the display, providing patients with a realistic and immersive virtual environment. The hand controller serves as a controller in the virtual environment, performing functions such as selecting virtual scenes and moving virtual characters. The base station sets the size range of the real environment occupied by the virtual scene to standardize the movable range of breathing training. At the same time, the locator performs real-time data transmission with the head-mounted display and hand controller to track the user’s real-time location.
3.3. Interaction between Breathing Data and Virtual Scenes
3.4. Virtual Scene Design
The “blow out candles” scene is designed based on the indoor environment. The scene includes tables, chairs, corridors, halls, bathrooms, furniture and other items. The user performs breathing training according to the voice prompt instructions, walks to the candle and blows on the candle. When the maximum forced respiratory volume (FVC) reaches the set threshold, the candle is extinguished.
The “Dandelion Blowing” scene is designed with the theme of a park, which contains a variety of trees, buildings, vegetation, rockeries, etc. Users can walk freely in the park. There are many dandelions in the grass. According to the task prompt, the user picks up the dandelions for breathing training, and blows on the dandelions after picking them up. When FVC reaches the set threshold, the dandelions are blown away, and the trained data is visually output. The system sets that the user needs to complete five breathing exercises to complete the task. At the same time, it is equipped with a voice prompt function, which can increase the fun and experience of the user.
3.5. Breathing Data Collection Interaction and Visualization
3.5.1. Respiratory Data Collection
The respiratory data are collected through the sensor, the data signal output of the vital capacity sensor is connected to the computer through the serial port, and the data are transmitted to the PC in the form of serial communication. First establish the communication format between the sensor and the scene-driven engine Unity3D, initialize the serial port, and configure the virtual serial port, baud rate, parity bit, data bit, and stop bit. Then, connect the disposable blowpipe to the sensor and hold the lower end of the sensor. After the preparation is completed, start to blow air. After blowing, data will be transmitted to the computer. When the breath stops or intermittent breath occurs during the blowing process, the sensor will determine that the data transmission has ended. At the same time, when collecting respiratory data, do not block the exhaust hole, otherwise it will affect the current vital capacity collection results. During use, avoid debris blocking the sensor’s internal detector, otherwise it will affect the accuracy of the sensor’s respiratory data collection.
3.5.2. Analysis of Respiratory Data
| Algorithm 1: Respiratory data analysis algorithm. |
|
Input: collected respiratory data collection “cache” Output: Hexadecimal respiratory data set “lungData” 1. if cache.Count!=0 then 2. for int i = cache.Count-1; i >= 0; i– do 3. if i! = 0 then 4. if cache[i] == 0xc1&&cache[i-1] == 0xf0 then 5. Array.Copy(cache.ToArray(),i + 1,endData,0,endData.Length) 6. isReceived = true 7. cache.Clear() 8. if isReceived then 9. for int i = 0; i < endData.Length; i++ do 10. if i < 22 &&i % 2 == 0 then 11. hex += endData[i].ToString(“X2”) 12. hex += endData[i + 1].ToString(“X2”) 13. lungData.data.Add(Explain(hex)) 14. else if i < 25 then 15. hex += endData[i].ToString(“X2”) 16. data.Add(Explain(hex)) 17. lungData.GetDetail() |
3.5.3. Analysis of Respiratory Data
| Algorithm 2: Respiratory data interaction and visualization algorithm. |
|
1. if data.Count == 14 then 2. time = data[0],fvc = data[1],fef = data[2],mef25 = data[3],mef50 = data[4], mef75 = data[5],fef25–75 = data[6],pef25-75 = data[7],fev1 = data[8], fev2 = data[9],fev3 = data[10],v1f = data[11],v2f = data[12],v3f = data[13] 3. data.Clear() 4. if data.fvc > 1000 then 5. foreach var item in particle then 6. item.Stop() 7. item.transform.GetChild(0).gameObject.SetActive(false) 8. if Target ! = null then 9. if flag == false then 10. StartPort port = new StartPort() 11. byte[] data = GetData(port) 12. localClient.Send(data) 13. StartPort() 14. DebugMessage.Log() 15. Break |
4. Experiments and Results
4.1. Participants
To ensure the validity of the assessment of effect, excluding patients with other lung function, participants met the following criteria:
-
Meet the diagnostic criteria for COPD;
-
During the rehabilitation training period, there is no resistance to cooperate with training and other behaviors;
-
Good compliance during rehabilitation training and tolerance during training.
4.2. Experimental Process
After each breathing session, each participant will receive a questionnaire to fill out regarding the training experience. This scale examines participants’ feelings about training through the following questions:
-
During training, do you feel bored?
-
During the training process, are you distracted and have trouble concentrating?
-
During the training process, are you able to keep up with the training pace?
4.3. Experimental Results and Analysis
During this respiratory rehabilitation training, the changes in respiratory data parameters of each participant before and after training were recorded to measure the effectiveness of the training system. The experiment found that the breathing training effect of each participant has improved. In this article, the breathing data of each participant before and after training are used as a measure of the effect of this experiment. At the same time, the mean values of the data before and after training for the two groups of participants were obtained for comparison.
5. Conclusions
Traditional rehabilitation training lacks clear breathing data, and the training process is very tedious. In contrast, this article studies a biofeedback respiratory rehabilitation training system based on virtual reality technology, which reflects the interaction between respiratory data and virtual scenes during the rehabilitation training process, and realizes the quantification and visualization of respiratory data. At the same time, the effect of the user’s rehabilitation training is improved, and the enthusiasm and interest of the user are increased.
The purpose of this research system is to improve the lung function of patients with respiratory disorders and relieve symptoms such as dyspnea. Through VR equipment and respiratory data sensors, the interactive virtual scene of human breathing in the form of biofeedback is realized. We perform data analysis on the respiratory data, use the respiratory data to drive changes in the virtual scene, and realize the interaction between the respiratory data and the virtual scene. We use data visualization algorithms to quantify and visualize respiratory data to evaluate the effectiveness of patient breathing training. In the virtual scene of breathing training, interesting ways such as music and stories are used to guide patients to continuously perform breathing training in a comfortable process, so as to complete specific rehabilitation training tasks and goals. The system is evaluated from two aspects, including training effectiveness and user experience. Comparing the experimental results and experiences of 10 participants, the results show that compared with traditional respiratory rehabilitation training, this research system has better training effects and experience, and rehabilitation training is more positive.
The system enables patients with respiratory disorders to improve their respiratory function by completing training tasks in a virtual scene. It is easy to operate and has no restrictions on site and usage time, making it possible to incorporate it into a long-term pulmonary rehabilitation plan. Due to the interference of respiratory equipment in the process of respiratory data transmission, certain Gaussian white noise and random noise will be generated. The focus of follow-up research is to further improve and perfect the respiratory data collection and improve the accuracy of respiratory data transmission.
Author Contributions
Conceptualization, F.L.; Methodology, F.L.; Software, F.L. and Y.L.; Validation, F.L.; Resources, R.W.; Data curation, J.Z. (Jing Zhang); Writing—original draft preparation, F.L.; Writing—review and editing, L.S. and J.Z. (Jian Zhao); Visualization, Z.Z.; Project administration, L.S. All authors have read and agreed to the published version of the manuscript.
Funding
This work was supported in part by the Jilin Provincial Department of Science and Technology (Grant/Award Number: No. YDZJ202301ZYTS496), Jilin Provincial Department of Human Resources and Social Security (2022QN05), and The Education Department of Jilin Province (No. JJKH20230673KJ).
Institutional Review Board Statement
Not applicable.
Informed Consent Statement
Informed consent was obtained from all subjects involved in the study.
Data Availability Statement
Not applicable.
Conflicts of Interest
The authors declare no conflict of interest.
References
- Annesi-Maesano, I.; Forastiere, F.; Balmes, J.; Garcia, E.; Harkema, J.; Holgate, S.; Kelly, F.; Khreis, H.; Hoffmann, B.; Maesano, C.N.; et al. The clear and persistent impact of air pollution on chronic respiratory diseases: A call for interventions. Eur. Respir. J. 2021, 57, 2002981. [Google Scholar] [CrossRef] [PubMed]
- Gutiérrez Villegas, C.; Paz-Zulueta, M.; Herrero-Montes, M.; Parás-Bravo, P.; Madrazo Pérez, M. Cost analysis of chronic obstructive pulmonary disease (COPD): A systematic review. Health Econ. Rev. 2021, 11, 31. [Google Scholar] [CrossRef] [PubMed]
- Lu, Y.; Li, P.; Li, N.; Wang, Z.; Li, J.; Liu, X.; Wu, W. Effects of home-based breathing exercises in subjects with COPD. Respir. Care 2020, 65, 377–387. [Google Scholar] [CrossRef] [PubMed]
- Liu, W.-Y.; Meijer, K.; Delbressine, J.M.; Willems, P.J.; Wouters, E.F.M. Spruit MA.Effects of Pulmonary Rehabilitation on Gait Characteristics in Patients with COPD. J. Clin. Med. 2019, 8, 459. [Google Scholar] [CrossRef]
- Respiratory Disease Branch of Chinese Geriatrics Society, Respiratory Rehabilitation Professional Committee of China Rehabilitation Medical Institutions Alliance. Chinese expert consensus on the application of inhalation therapy in respiratory rehabilitation. Chin. J. Tuberc. Respir. Med. 2022, 45, 753–761. [Google Scholar]
- Fen, D.; Ling, Y.; Lu, Z.; Lan, H. Respiratory function exercise for patients with frailty and pulmonary heart disease. Chin. J. Lung Dis. Electron. Vers. 2020, 13, 429–431. [Google Scholar]
- Liu, X.; Wang, J.; Sun, J.; Pan, K.; Wu, K.; Sun, C.; Ma, H. Effects of respiratory function exercise combined with psychological nursing on cardiopulmonary function index, exercise tolerance, and quality of life in patients with stable chronic obstructive pulmonary. Int. J. Early Child. Spec. Educ. INT-JECSE 2021, 30, 138–148. [Google Scholar]
- Liu, G. Application of abdominal breathing training + balloon blowing in rehabilitation care of patients with chronic persistent asthma. Heilongjiang Med. 2022, 46, 2518–2520. [Google Scholar]
- Zheng, L. Effect of intensive cough and respiratory function training on pulmonary rehabilitation in adult patients with spontaneous pneumothorax undergoing closed drainage. Tibet. Med. 2022, 43, 108–110. [Google Scholar]
- Sadiq, N.; Sadiq, T.; Baloch, W.A.; Khan, H.F.; Rajpoot, N.N.; Ali, S. Modulation of Heart Rate Variability in Stressed Medical Students Via Breathing Exercise. Pak. J. Med. Health Sci. 2023, 17, 117. [Google Scholar] [CrossRef]
- Bortone, I.; Leonardis, D.; Mastronicola, N.; Crecchi, A.; Bonfiglio, L.; Procopio, C.; Solazzi, M.; Frisoli, A. Wearable haptics and immersive virtual reality rehabilitation training in children with neuromotor impairments. IEEE Trans. Neural Syst. Rehabil. Eng. 2018, 26, 1469–1478. [Google Scholar] [CrossRef] [PubMed]
- Chandrasiri, A.; Collett, J.; Fassbender, E.; De Foe, A. A virtual reality approach to mindfulness skills training. Virtual Real. 2020, 24, 143–149. [Google Scholar] [CrossRef]
- Lan, K.C.; Li, C.W.; Cheung, Y. Slow breathing exercise with multimodal virtual reality: A feasibility study. Sensors 2021, 21, 5462. [Google Scholar] [CrossRef]
- Colombo, V.; Aliverti, A.; Sacco, M. Virtual reality for COPD rehabilitation: A technological perspective. Pulmonology 2022, 28, 119–133. [Google Scholar]
- Mitsea, E.; Drigas, A.; Skianis, C. Breathing, Attention & Consciousness in Sync: The role of Breathing Training, Metacognition & Virtual Reality. Technium Soc. Sci. J. 2022, 29, 79. [Google Scholar]
- Patsaki, I.; Avgeri, V.; Rigoulia, T.; Zekis, T.; Koumantakis, G.A.; Grammatopoulou, E. Benefits from Incorporating Virtual Reality in Pulmonary Rehabilitation of COPD Patients: A Systematic Review and Meta-Analysis. Adv. Respir. Med. 2023, 91, 324–336. [Google Scholar] [CrossRef]
- Gouveia, É.R.; Campos, P.; França, C.S.; Rodrigues, L.M.; Martins, F.; França, C.; Gonçalves, F.; Teixeira, F.; Ihle, A.; Gouveia, B.R. Virtual Reality Gaming in Rehabilitation after Musculoskeletal Injury—User Experience Pilot Study. Appl. Sci. 2023, 13, 2523. [Google Scholar] [CrossRef]
- Pur, D.R.; Lee-Wing, N.; Bona, M.D. The use of augmented reality and virtual reality for visual field expansion and visual acuity improvement in low vision rehabilitation: A systematic review. Graefe’s Arch. Clin. Exp. Ophthalmol. 2023, 261, 1743–1755. [Google Scholar] [CrossRef]
- Si, T.; Zhu, Y.; Zongni, L. Application and Prospect of Immersive Virtual Reality Technology in Rehabilitation Practice of Autistic Children. Appl. Educ. Psychol. 2022, 3, 59–67. [Google Scholar]
- Ciorap, R.; Andriţoi, D.; Casuţă, A.; Ciorap, M.; Munteanu, D. Game-based virtual reality solution for post-stroke balance rehabilitation. IOP Conf. Ser. Mater. Sci. Eng. 2022, 1254, 012037. [Google Scholar]
- Rockstroh, C.; Blum, J.; Göritz, A.S. A mobile VR-based respiratory biofeedback game to foster diaphragmatic breathing. Virtual Real. 2021, 25, 539–552. [Google Scholar]
- Rutkowski, S.; Buekers, J.; Rutkowska, A.; Cieślik, B.; Szczegielniak, J. Monitoring physical activity with a wearable sensor in patients with copd during in-hospital pulmonary rehabilitation program: A pilot study. Sensors 2021, 21, 2742. [Google Scholar] [CrossRef] [PubMed]
- Zhou, L.; Zhou, Z.; Wu, Y.; Zhang, M. Application of mindfulness-based stress reduction therapy combined with music biofeedback therapy in infertile patients. Qilu Nurs. Mag. 2022, 28, 16–19. [Google Scholar]
- Patibanda, R.; Mueller, F.F.; Leskovsek, M.; Duckworth, J. Life Tree: Understanding the Design of Breathing Exercise Games. In Proceedings of the CHI PLAY ’17: The Annual Symposium on Computer-Human Interaction in Play, Amsterdam, The Netherlands, 15–18 October 2017; pp. 19–31. [Google Scholar]
- Greinacher, R.; Kojić, T.; Meier, L.; Parameshappa, R.G.; Möller, S.; Voigt-Antons, J.N. Impact of Tactile and Visual Feedback on Breathing Rhythm and User Experience in VR Exergaming. In Proceedings of the 2020 Twelfth International Conference on Quality of Multimedia Experience (QoMEX), Athlone, Ireland, 26–28 May 2020. [Google Scholar]
- Blum, J.; Rockstroh, C.; Göritz, A.S. Development and pilot test of a virtual reality respiratory biofeedback approach. Appl. Psychophysiol. Biofeedback 2020, 45, 153–163. [Google Scholar]
- Ji, W. Research on Interactive Design of Virtual Reality (VR) Animation; Central Academy of Fine Arts: Beijing, China, 2017. [Google Scholar]
- LoMauro, A.; Colli, A.; Colombo, L.; Aliverti, A. Breathing patterns recognition: A functional data analysis approach. Comput. Methods Programs Biomed. 2022, 217, 106670. [Google Scholar] [CrossRef]
- Keener, A. Redefining the diagnostic criteria for COPD. Nature 2020, 581, S4. [Google Scholar] [CrossRef]
- Agustí, A.; Celli, B.R.; Criner, G.J.; Halpin, D.; Anzueto, A.; Barnes, P.; Bourbeau, J.; Han, M.K.; Martinez, F.J.; de Oca, M.M.; et al. Global initiative for chronic obstructive lung disease 2023 report: GOLD executive summary. Am. J. Respir. Crit. Care Med. 2023, 207, 819–837. [Google Scholar] [CrossRef]
- Adeloye, D.; Song, P.; Zhu, Y.; Campbell, H.; Sheikh, A.; Rudan, I.; NIHR RESPIRE Global Respiratory Health Unit. Global, regional, and national prevalence of, and risk factors for, chronic obstructive pulmonary disease (COPD) in 2019: A systematic review and modelling analysis. Lancet Respir. Med. 2022, 10, 447–458. [Google Scholar] [CrossRef]
Figure 1.
System frame structure diagram.
Figure 1.
System frame structure diagram.
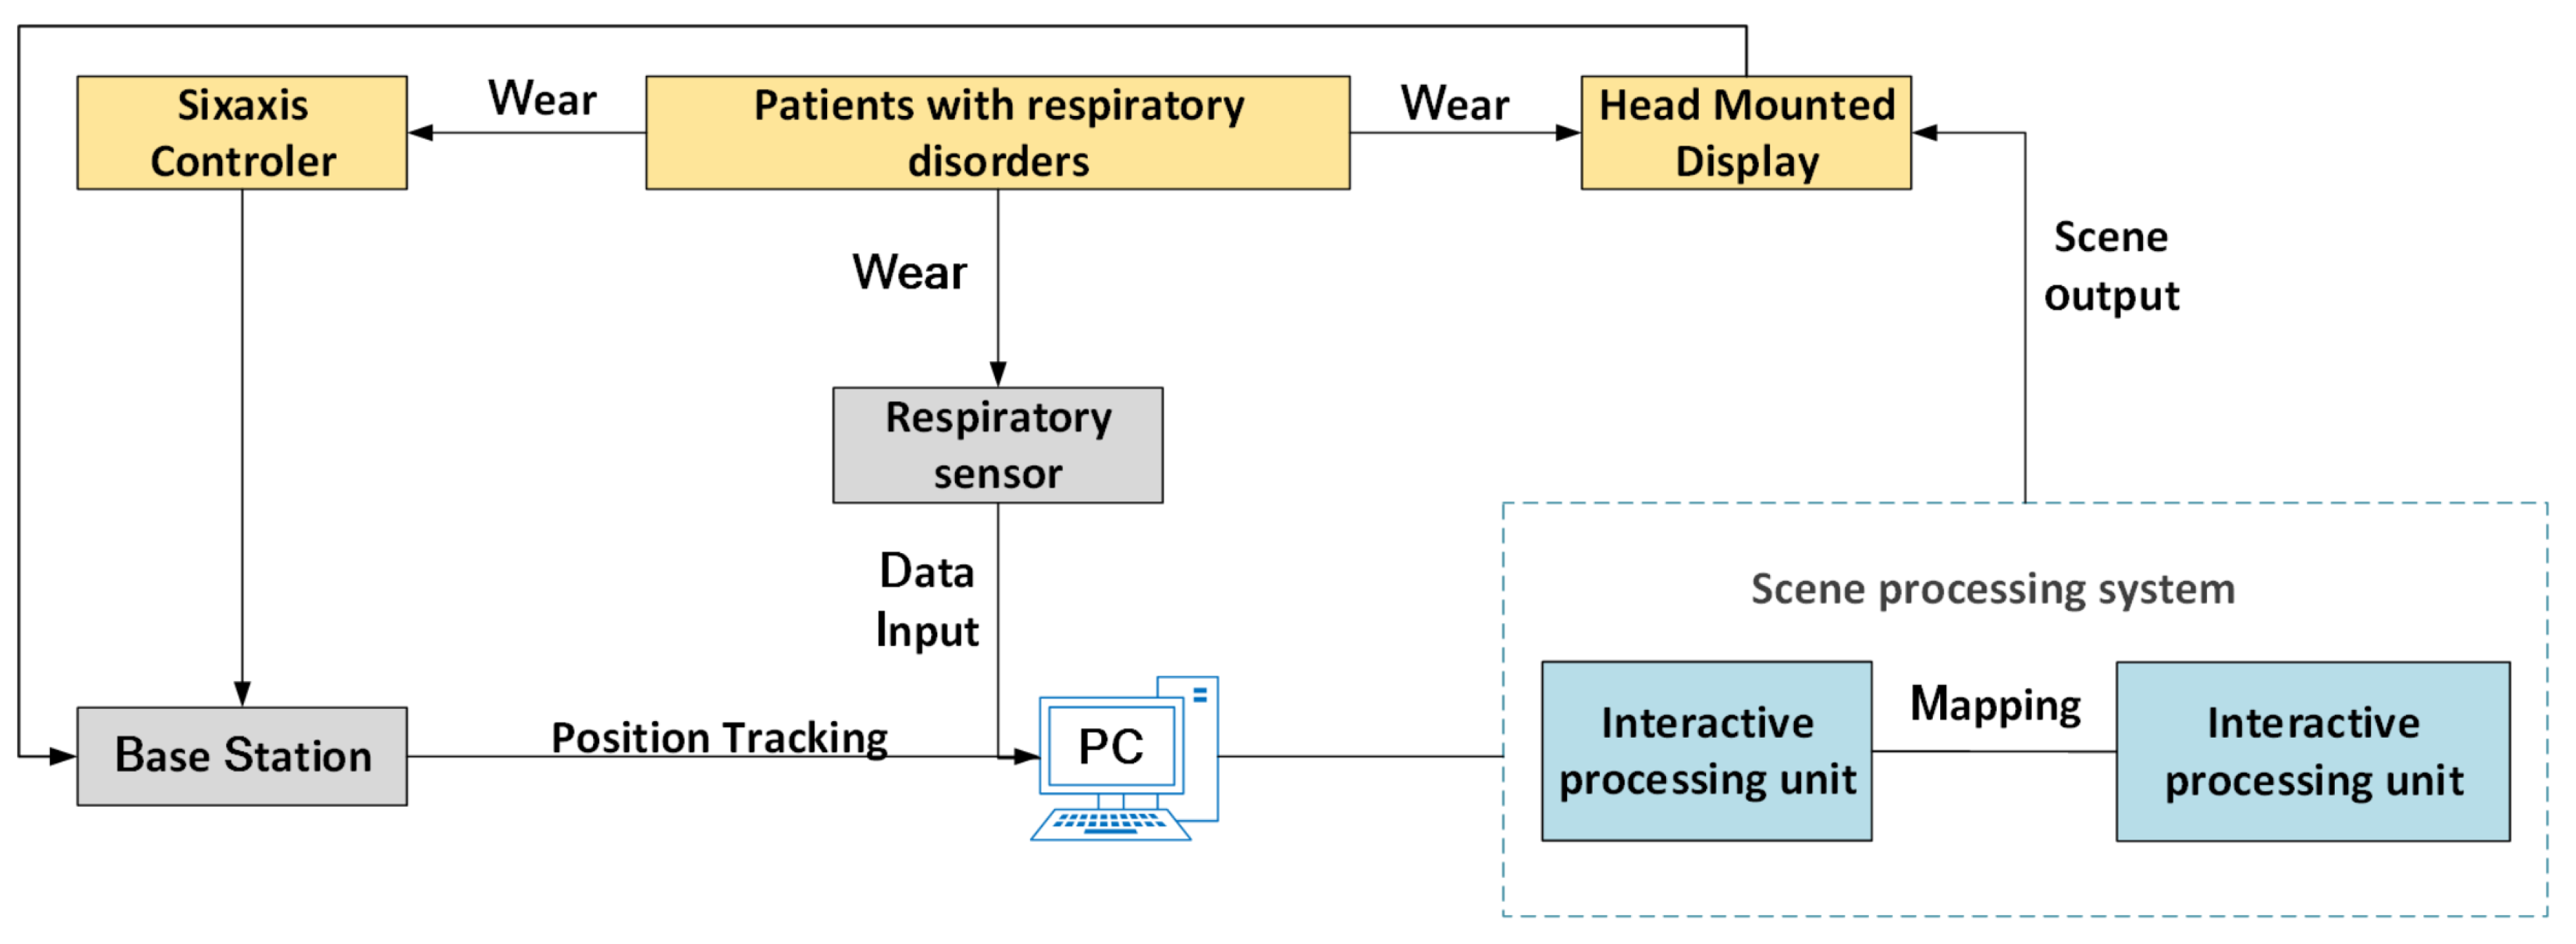
Figure 2.
HTC Vive pro2 device.
Figure 2.
HTC Vive pro2 device.
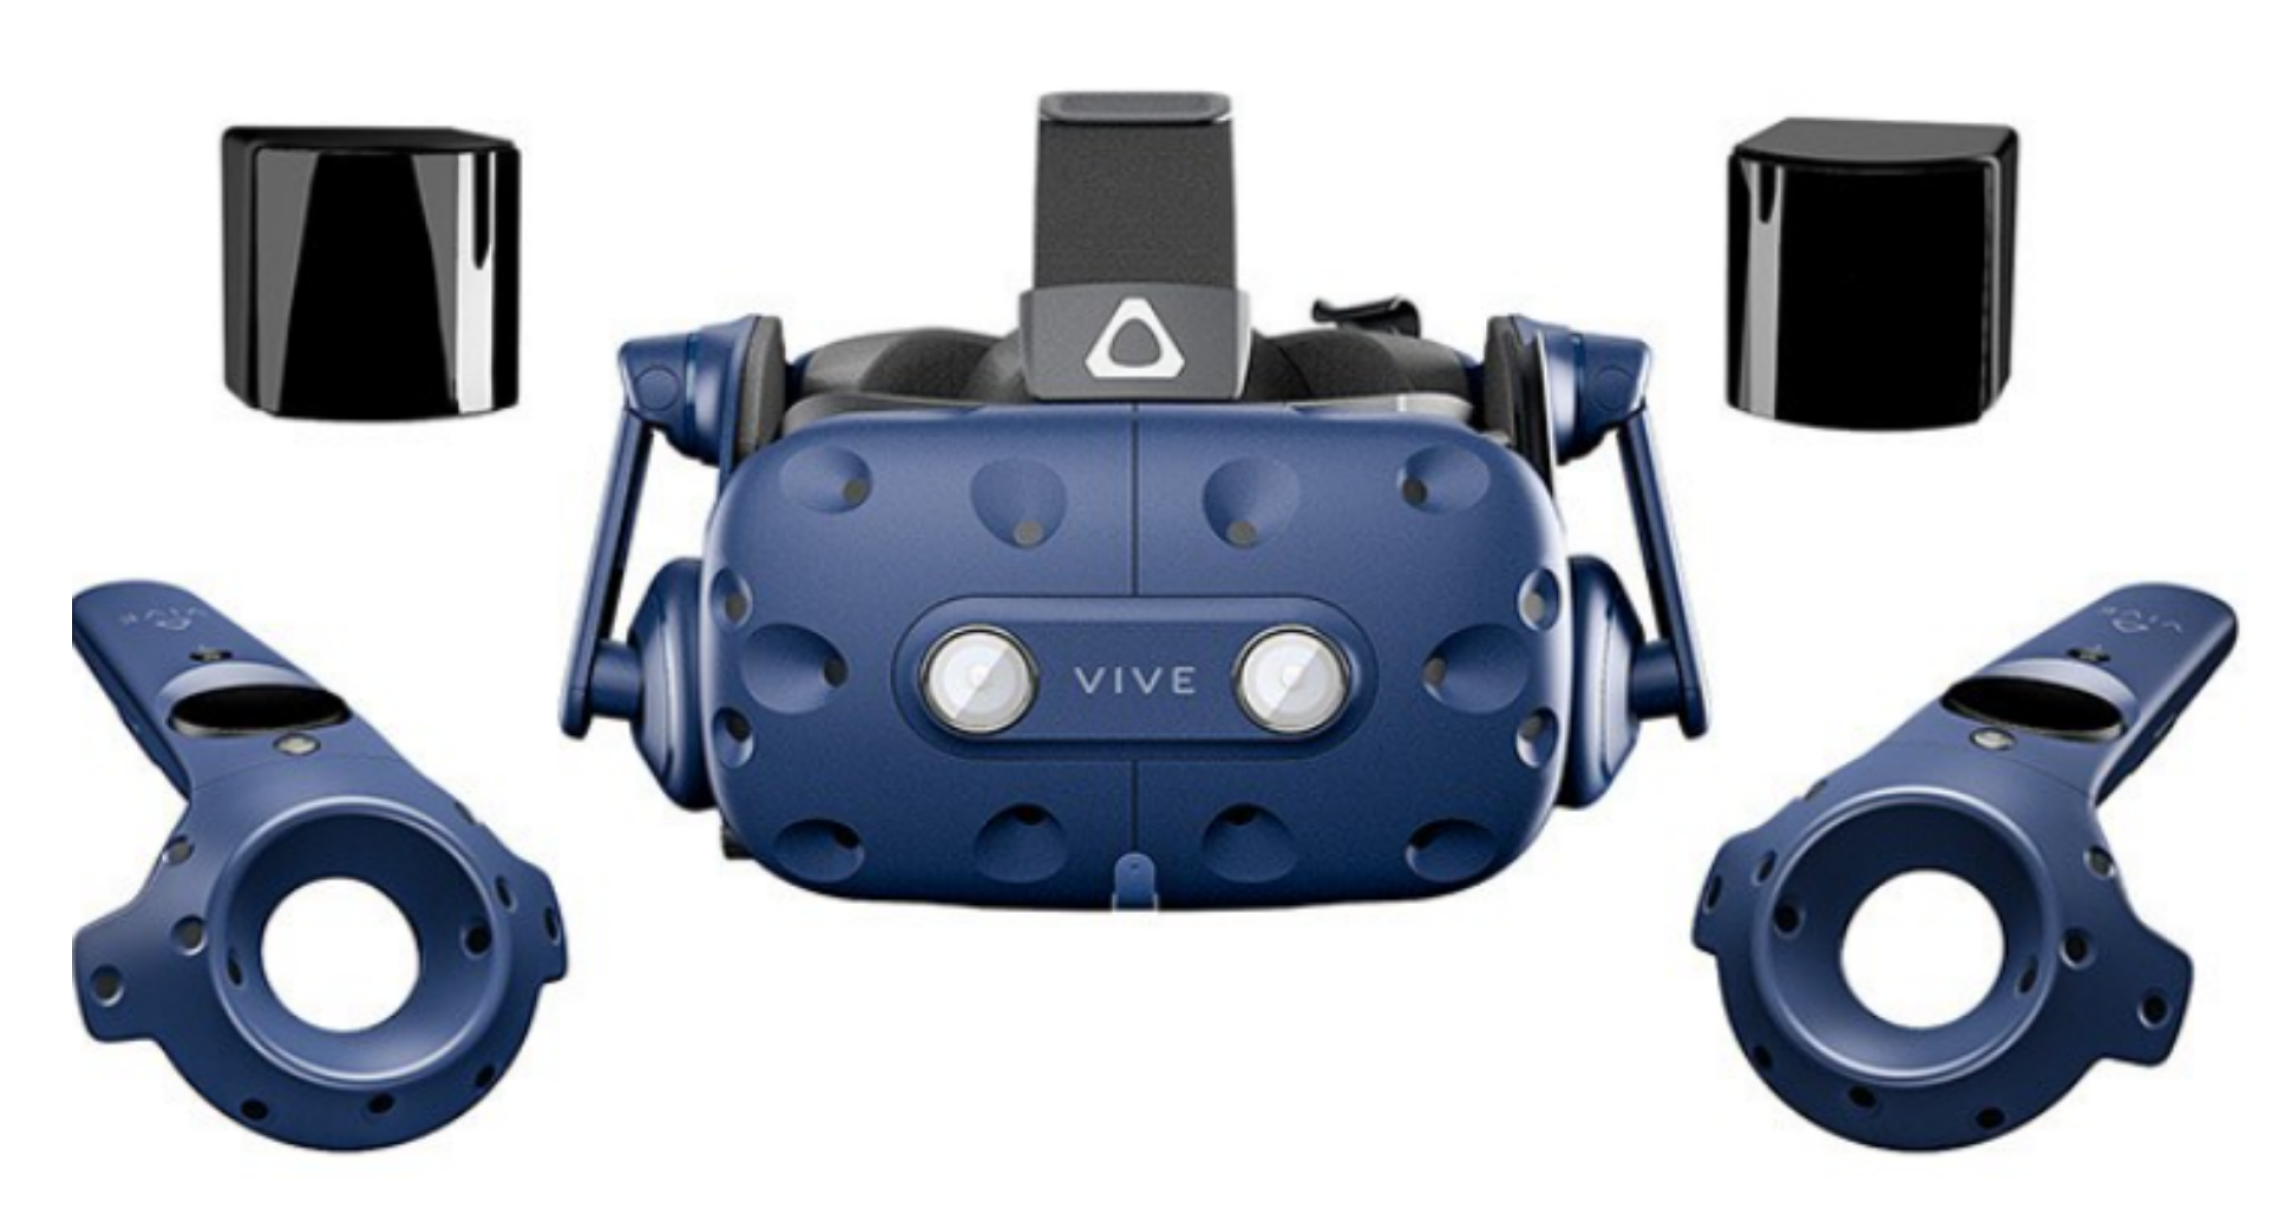
Figure 3.
Data transmission and tracking technology.
Figure 3.
Data transmission and tracking technology.
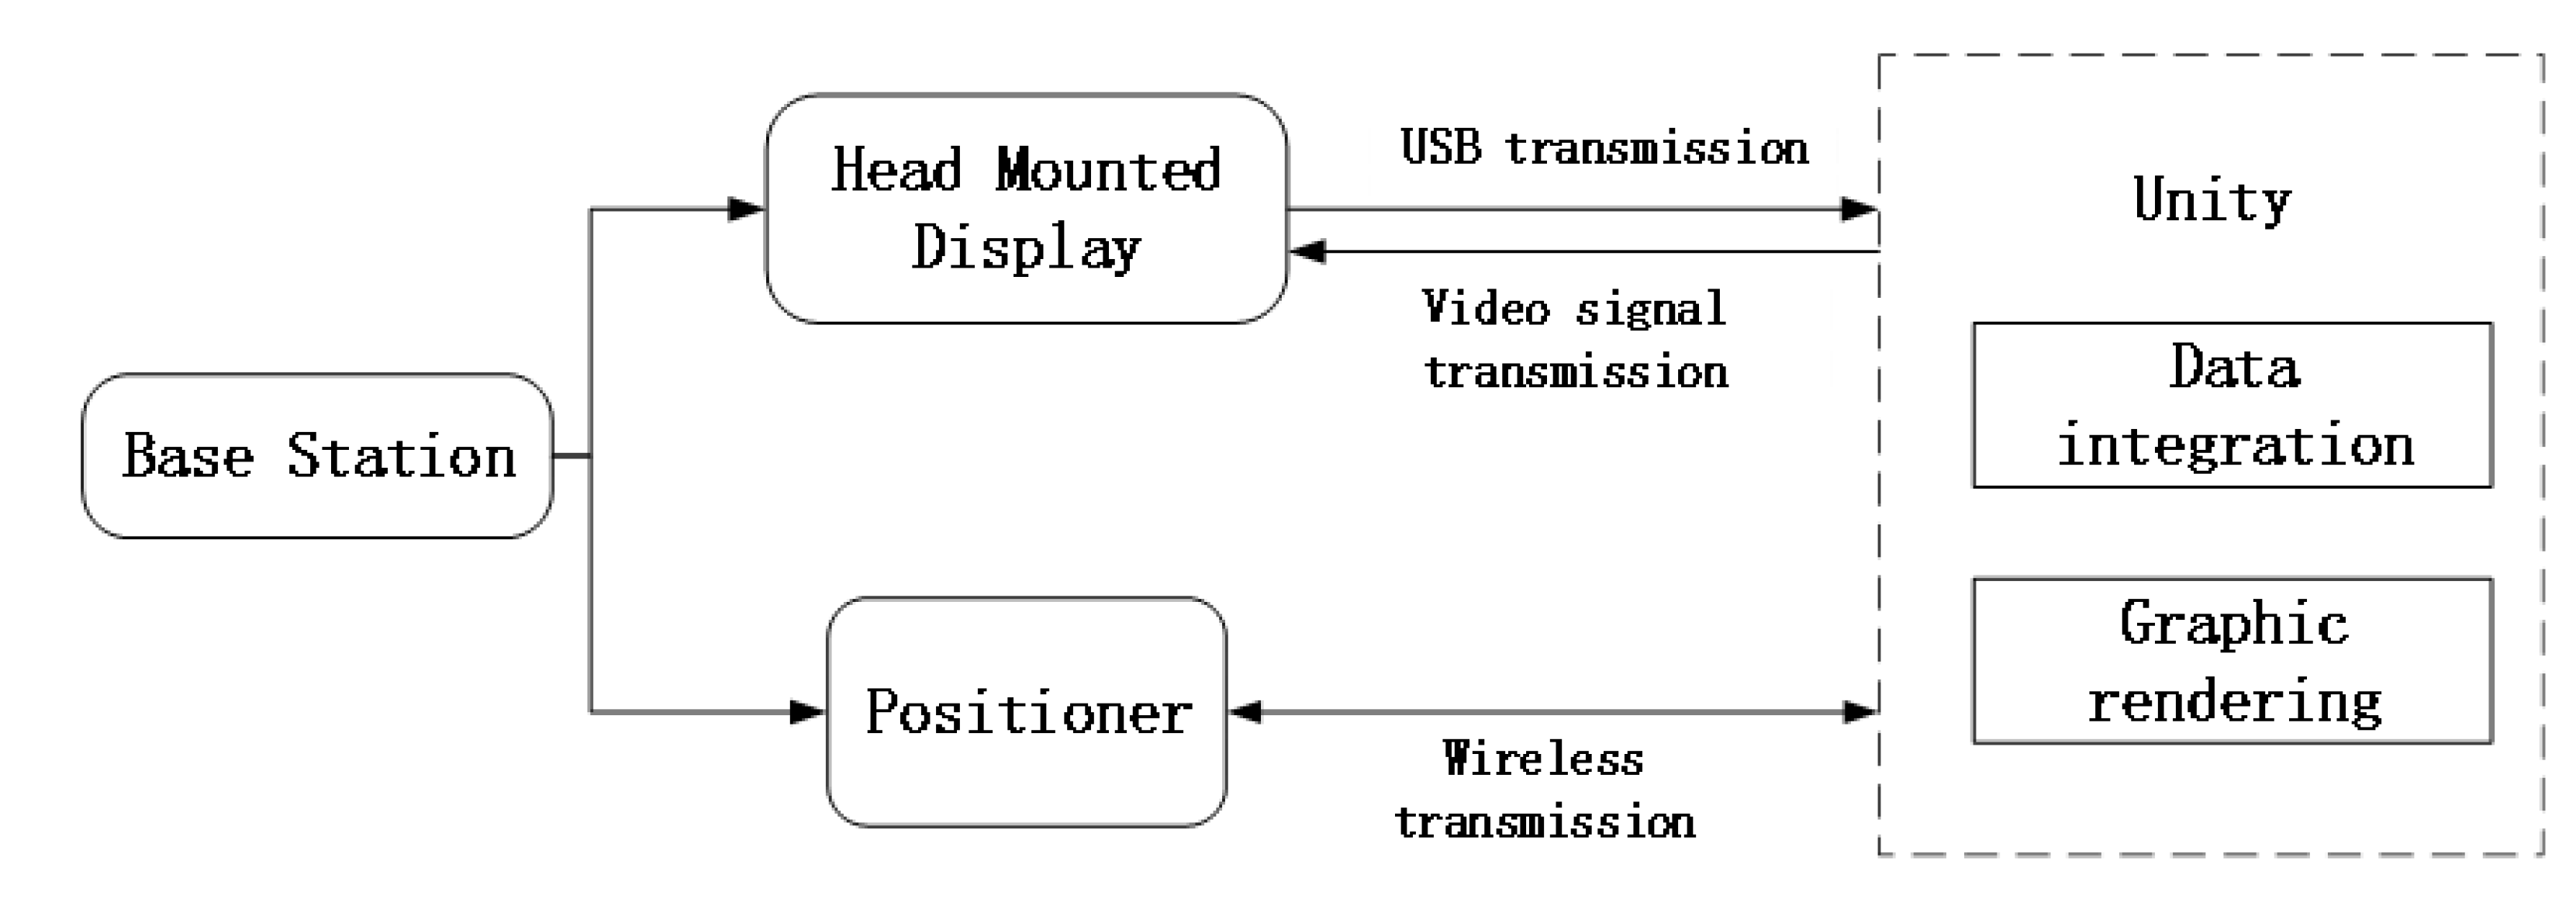
Figure 4.
HKF-20C vital capacity sensor.
Figure 4.
HKF-20C vital capacity sensor.
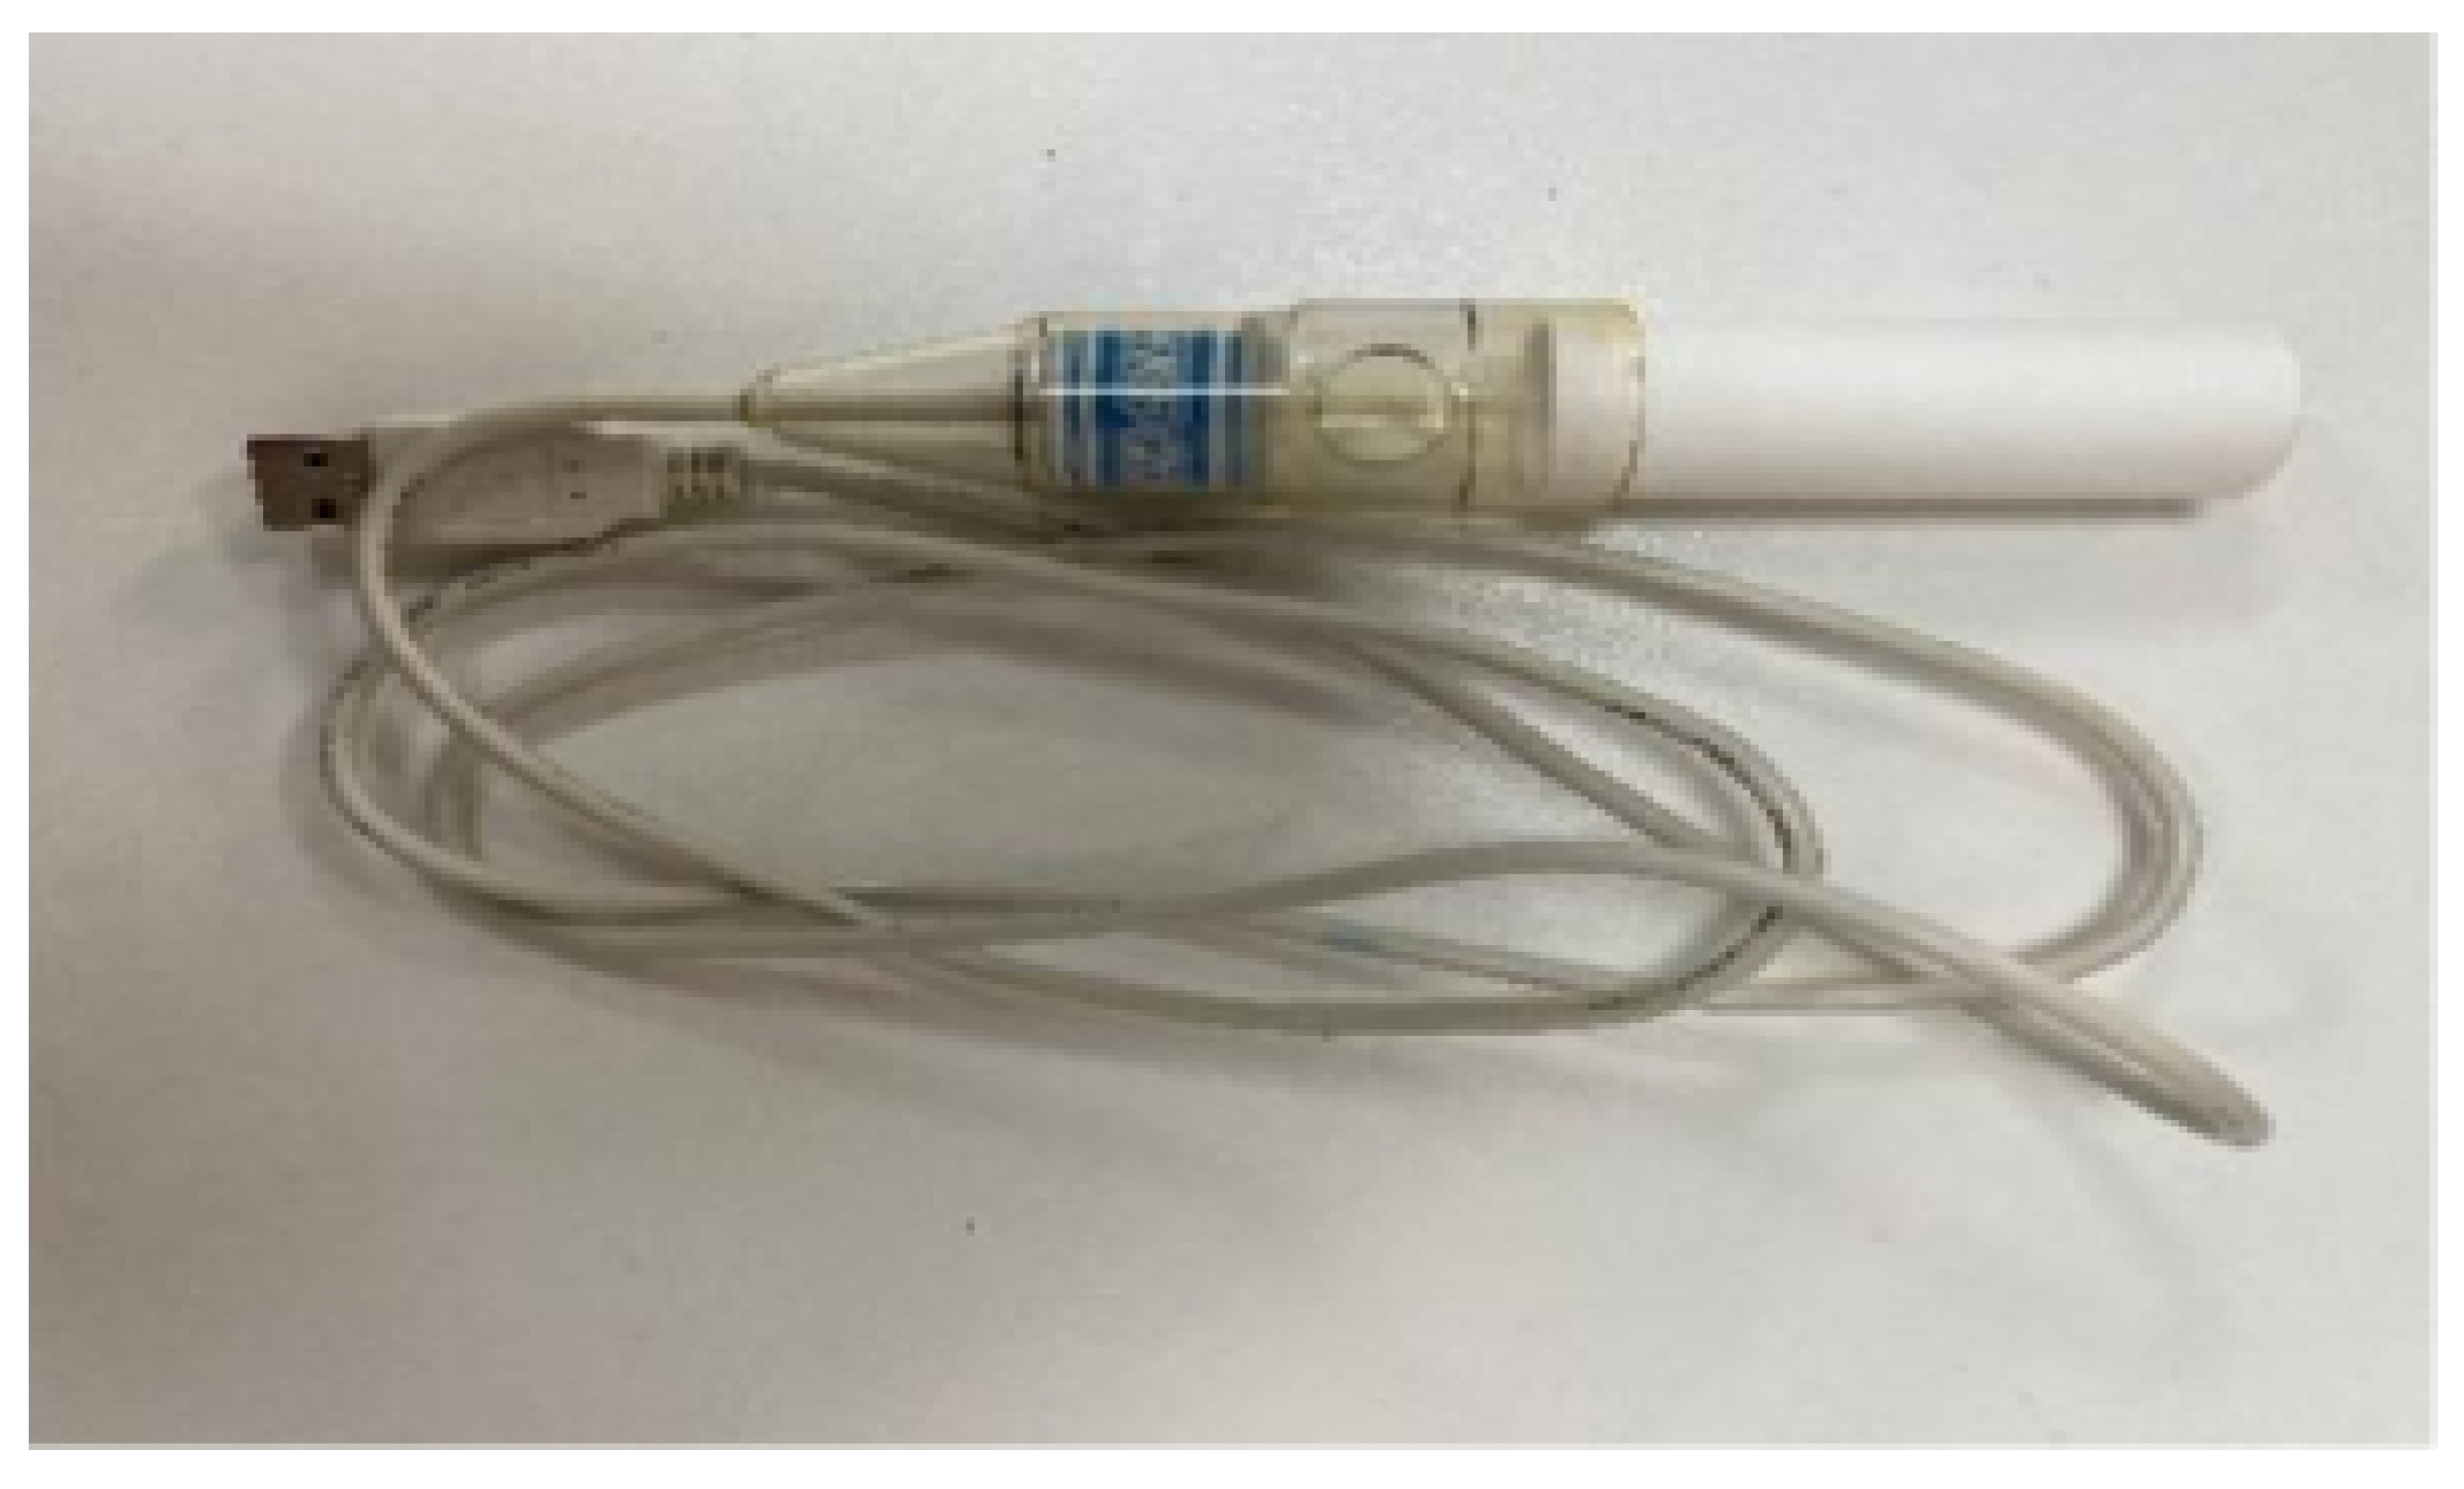
Figure 5.
Interaction between respiratory data and virtual scene.
Figure 5.
Interaction between respiratory data and virtual scene.
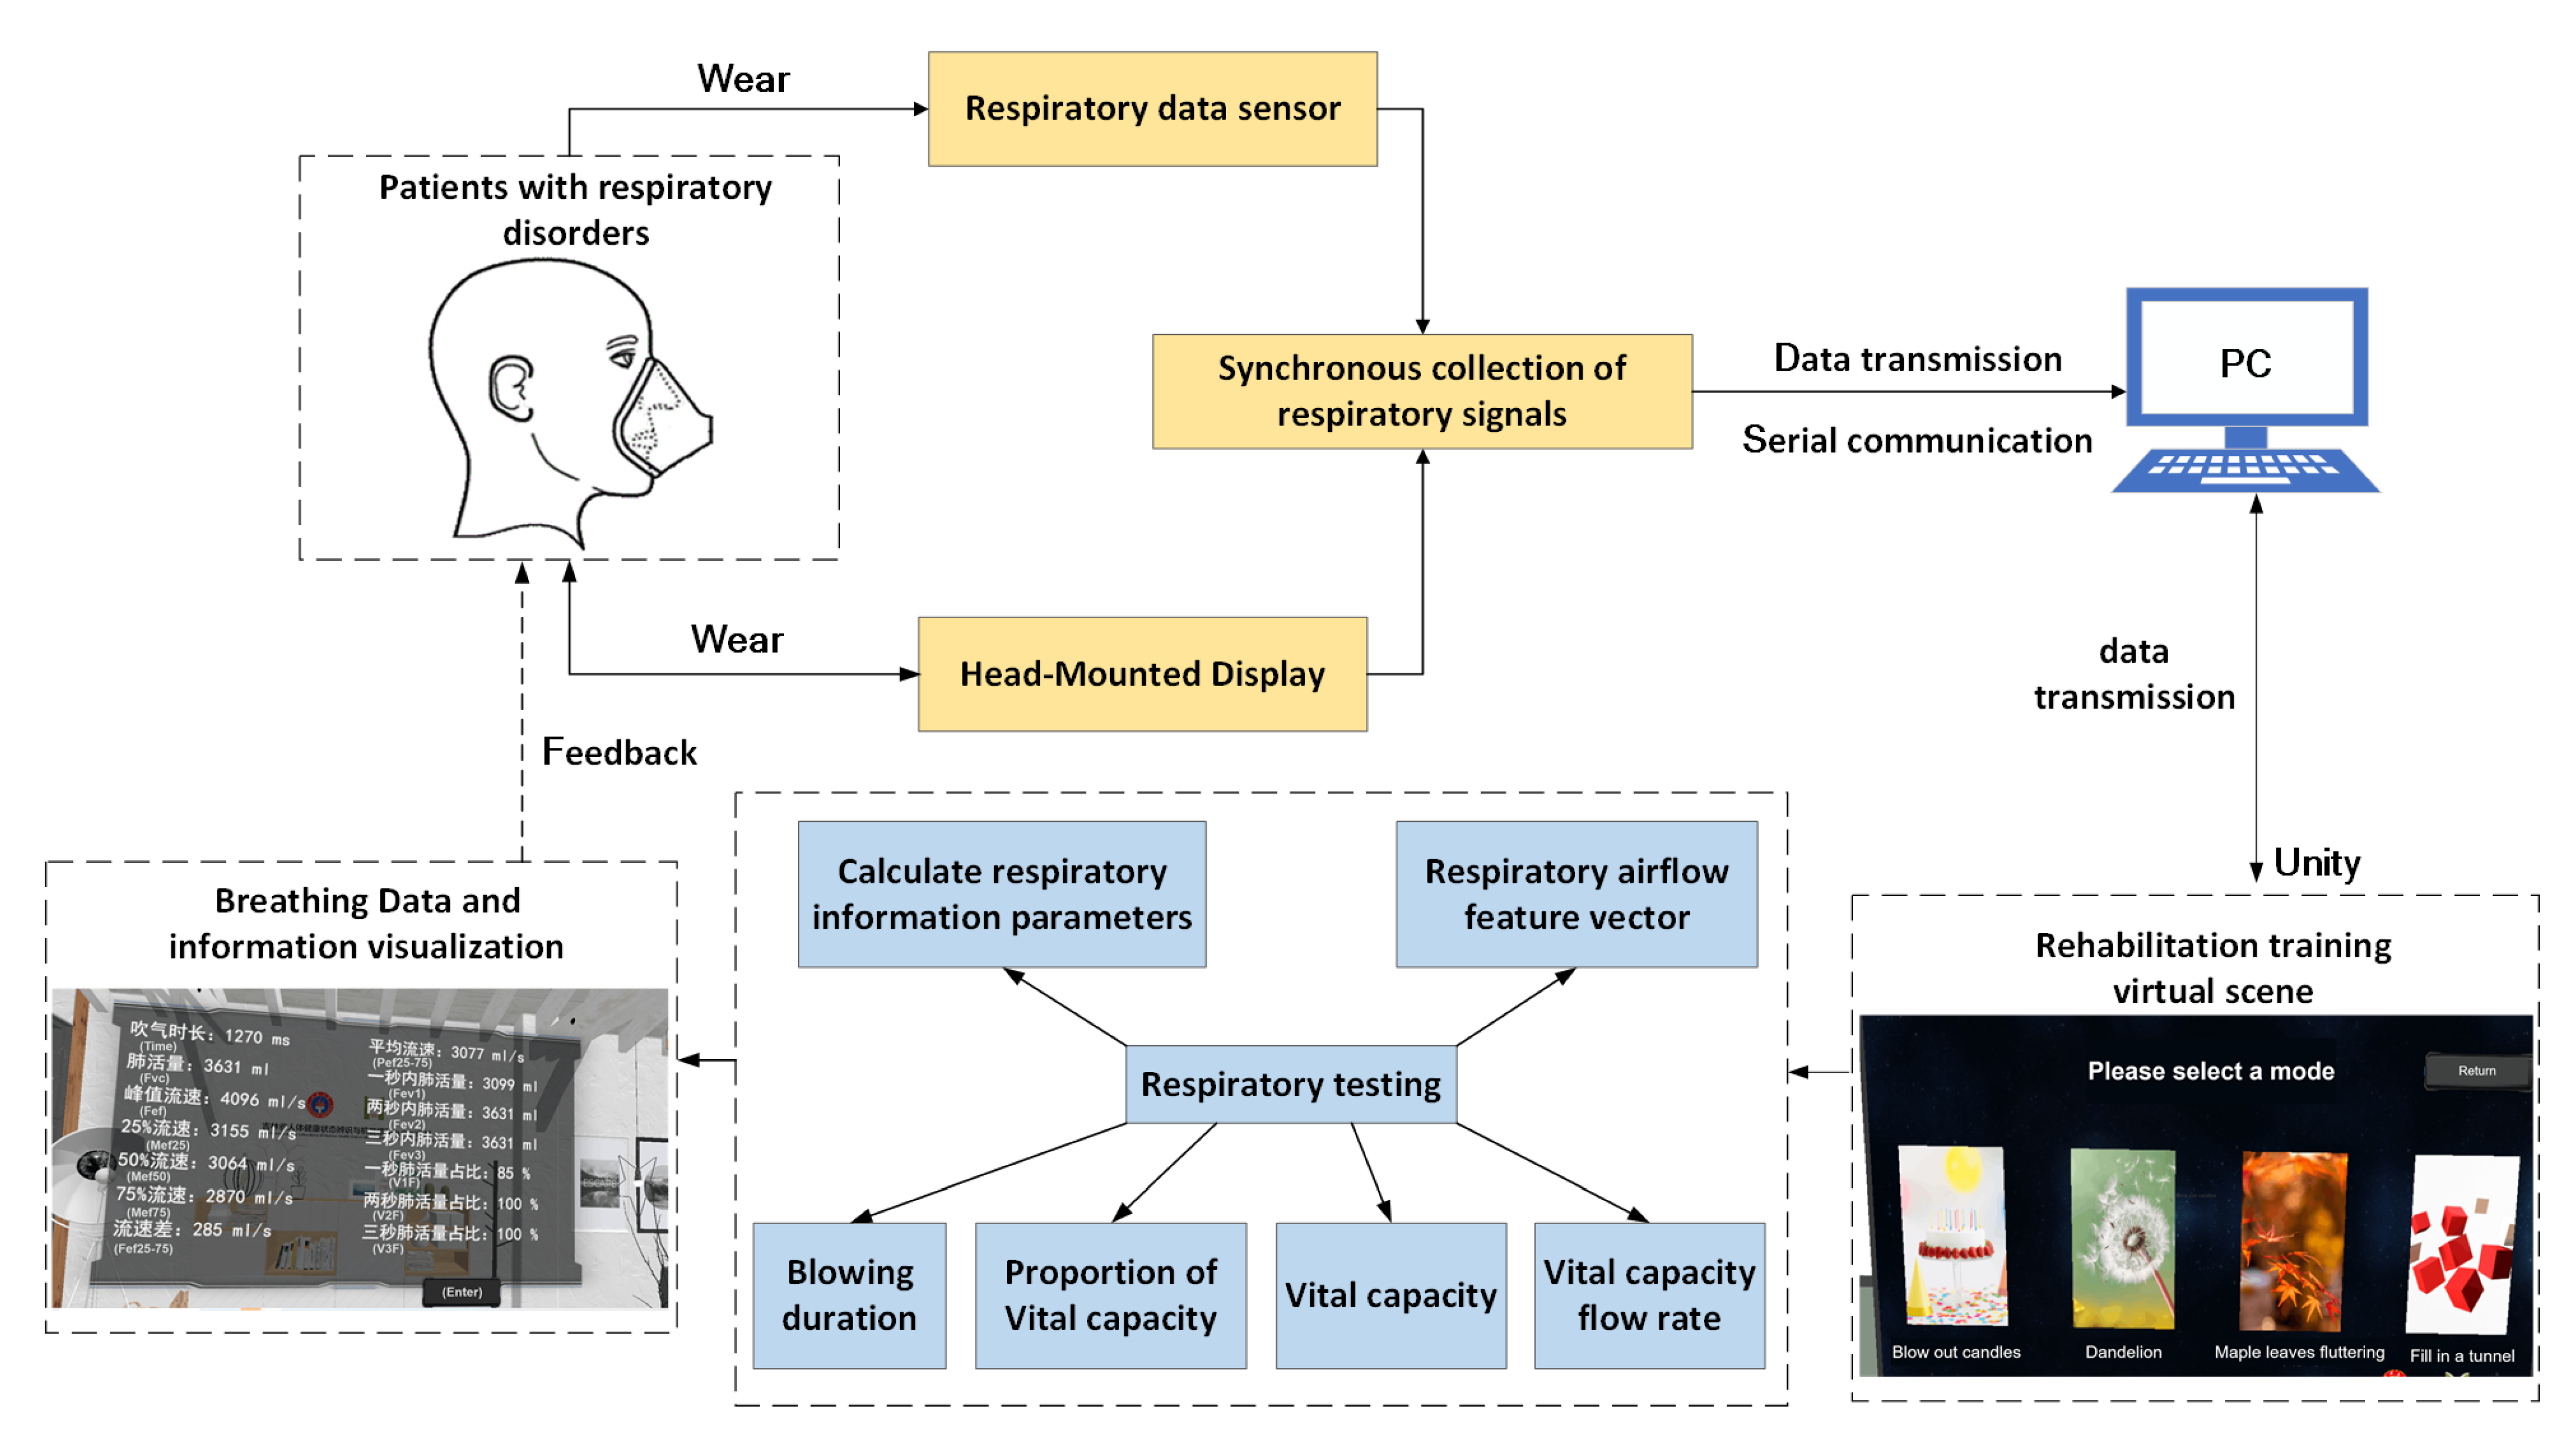
Figure 6.
Blowing out the candle scene.
Figure 6.
Blowing out the candle scene.
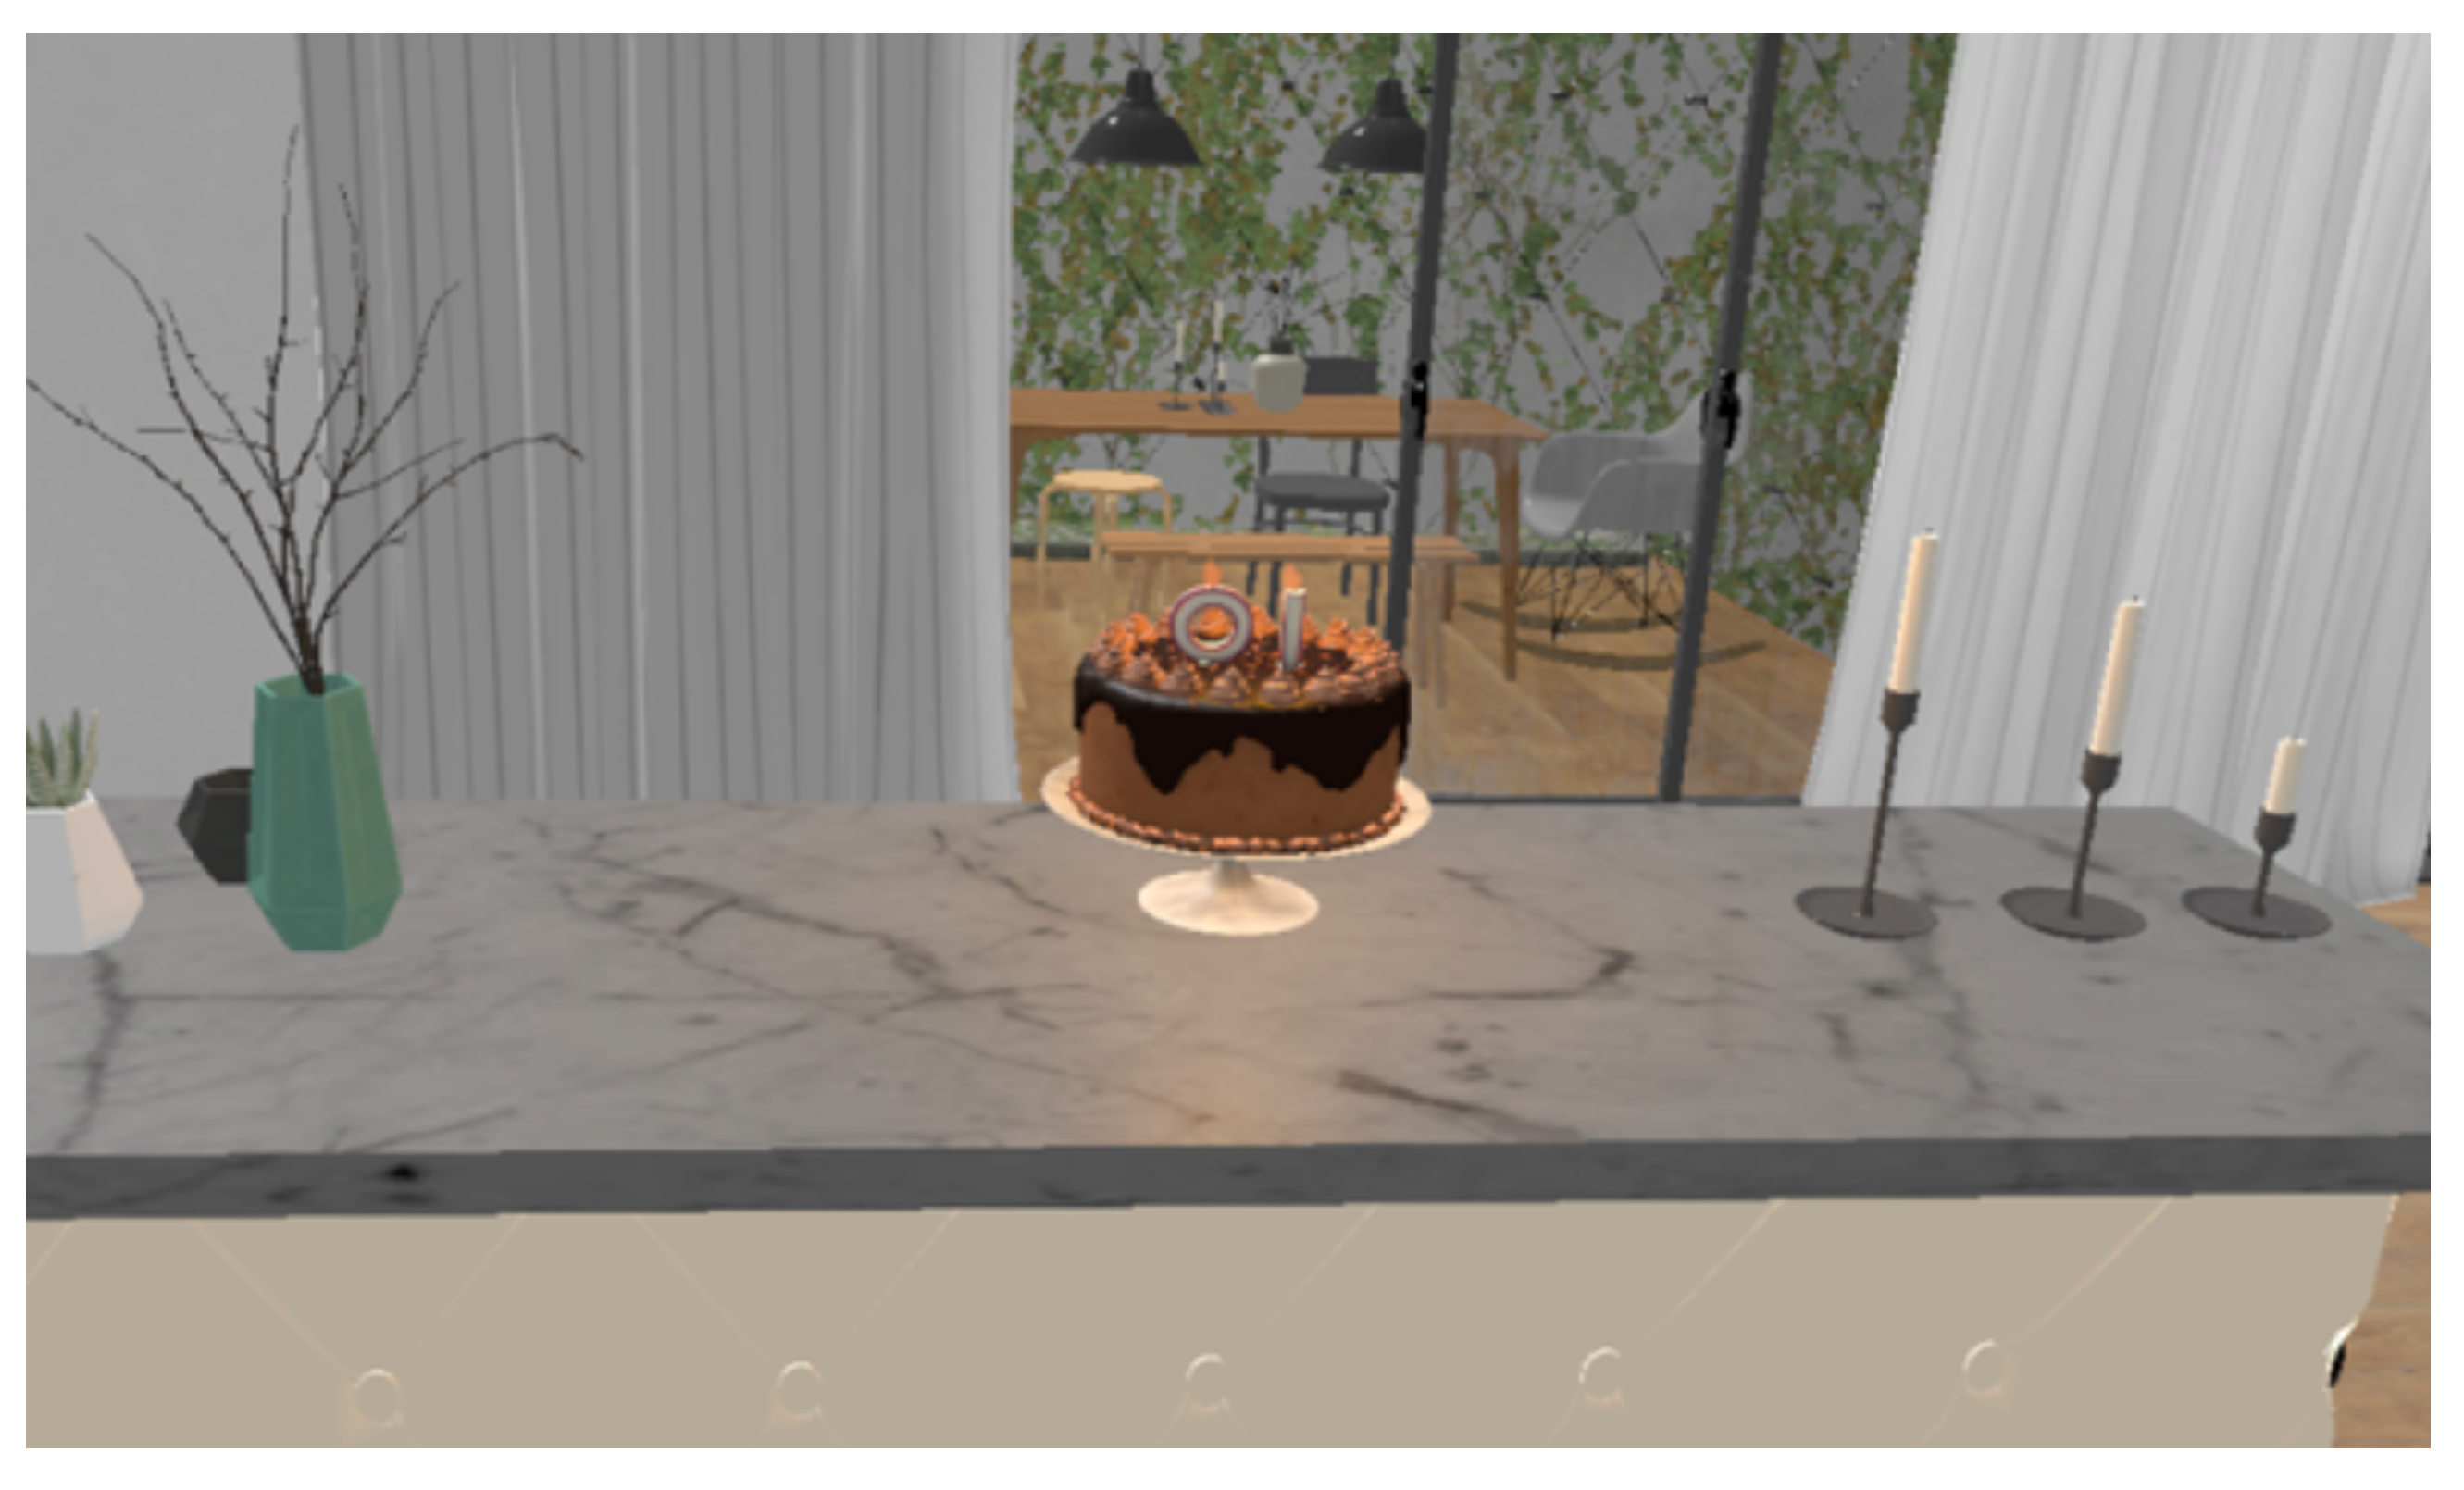
Figure 7.
Blowing dandelion scene.
Figure 7.
Blowing dandelion scene.
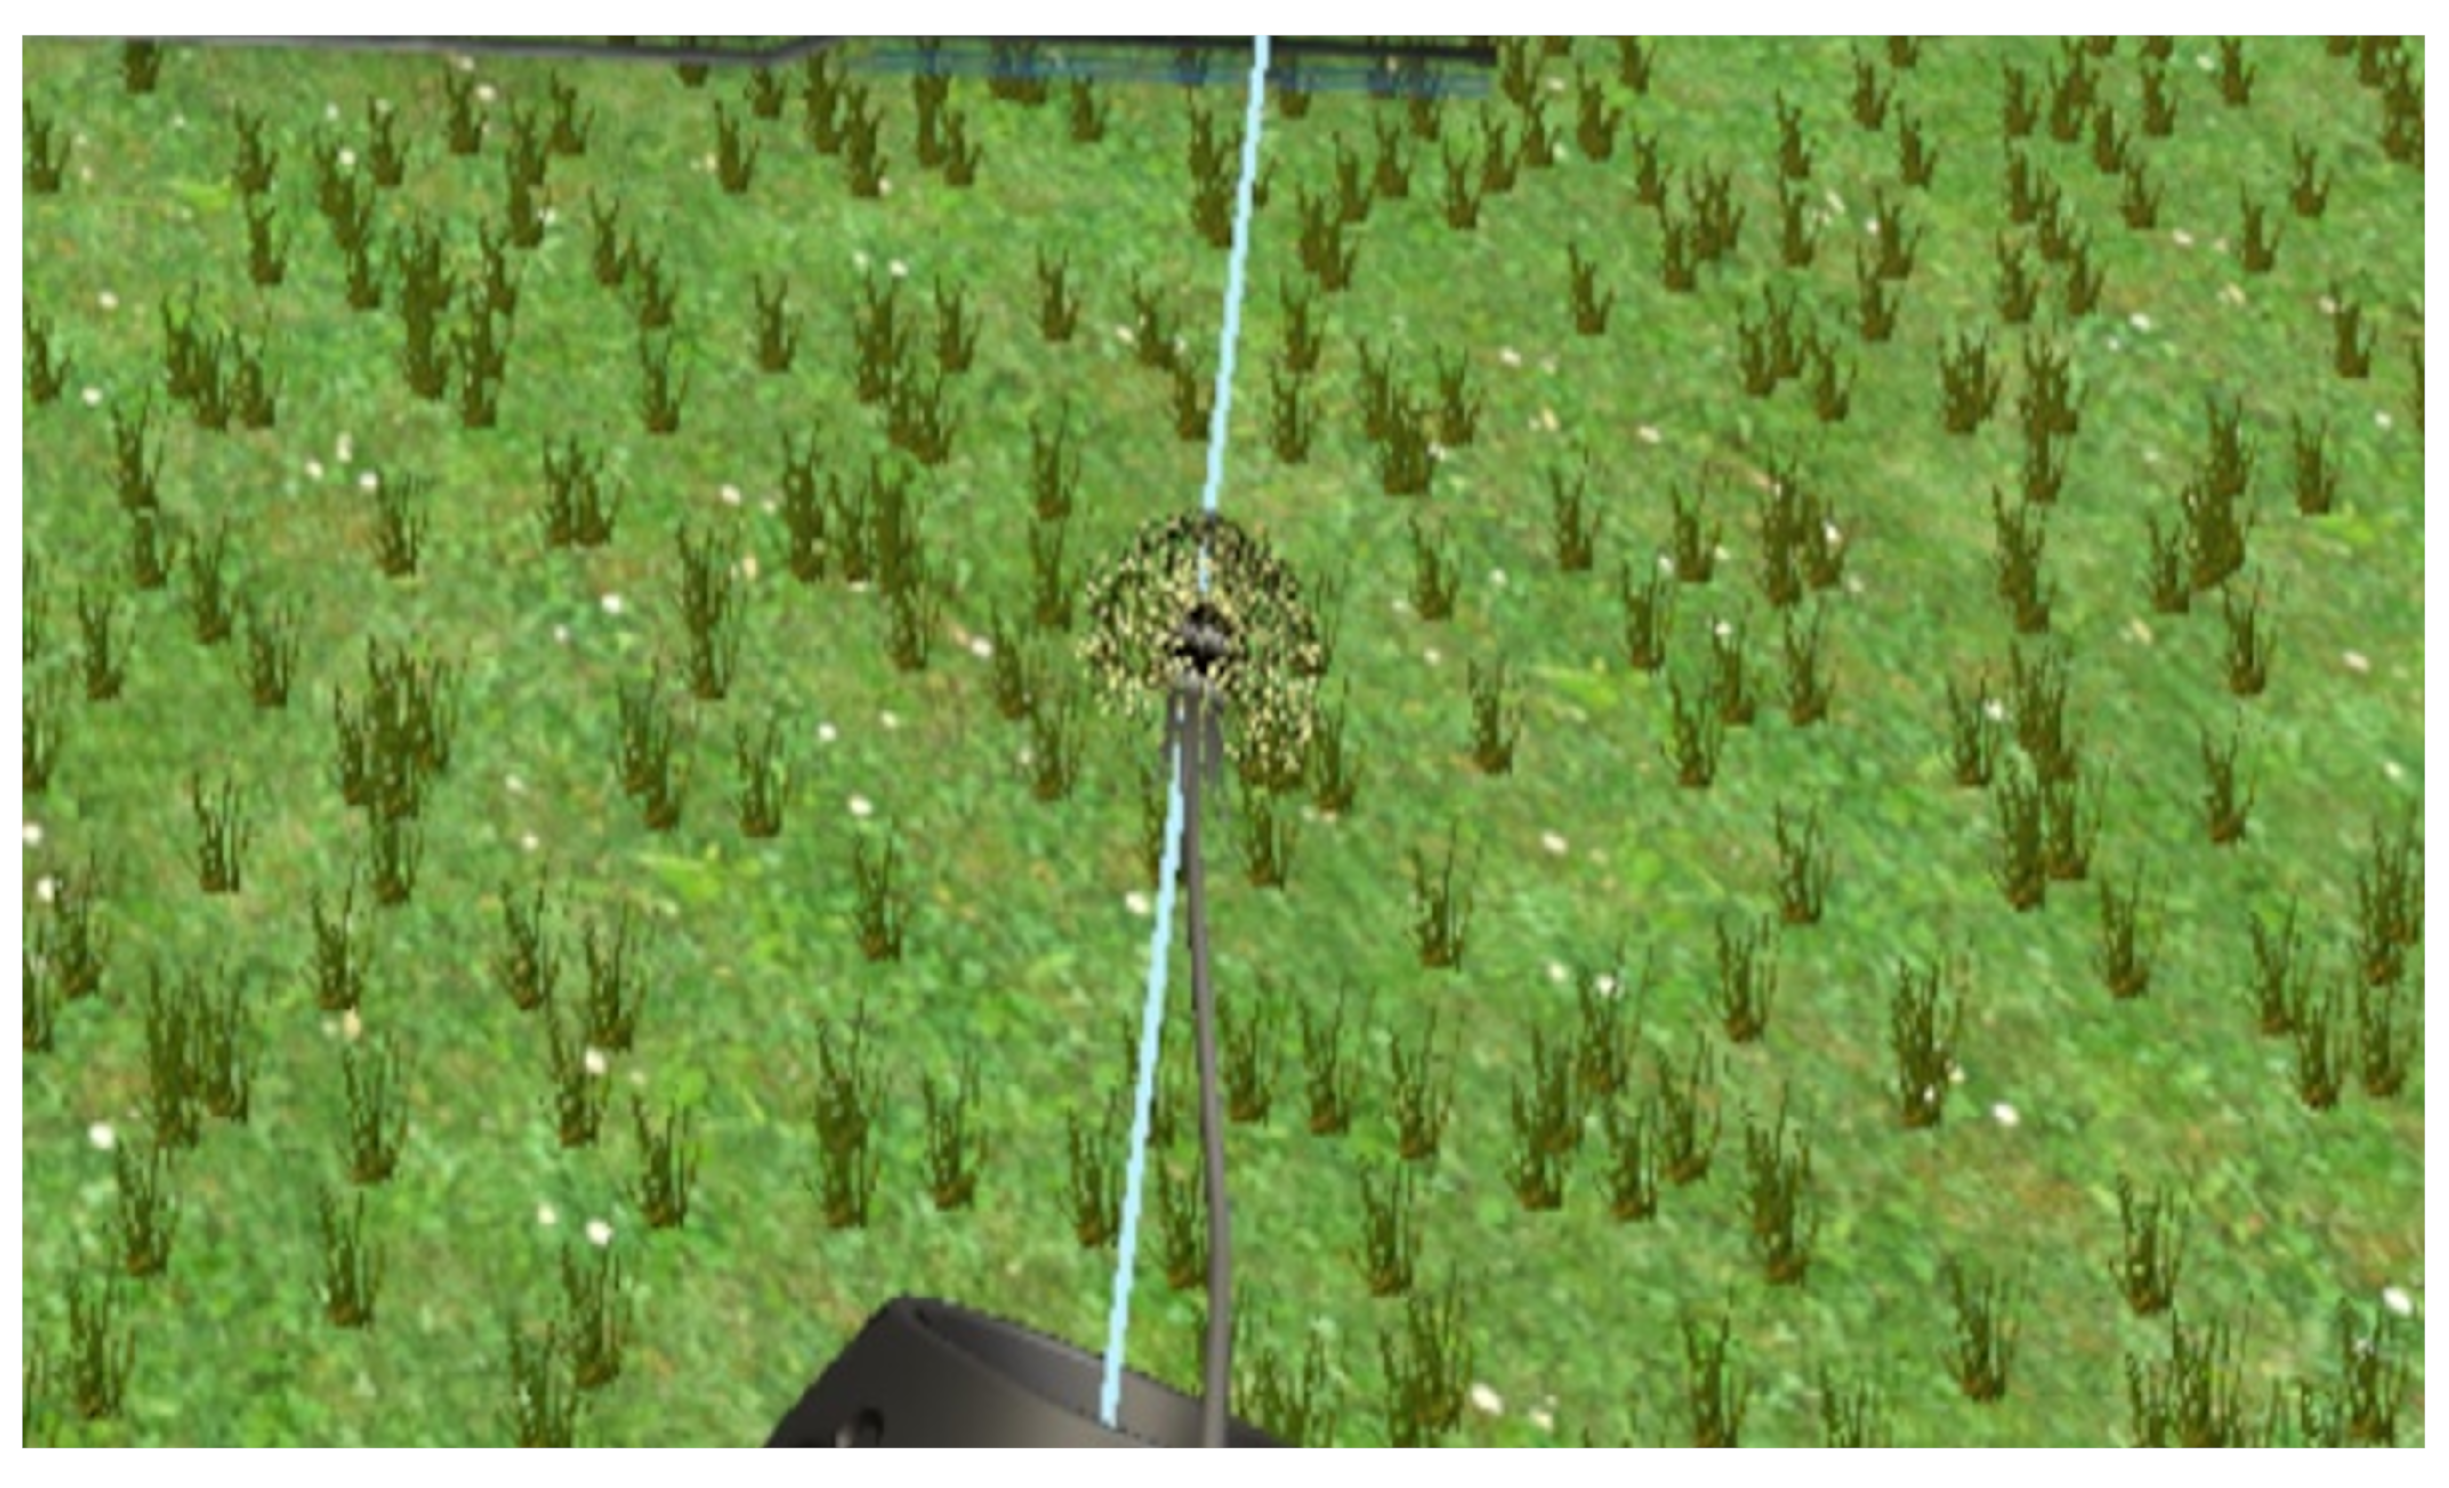
Figure 8.
Respiration data visualization.
Figure 8.
Respiration data visualization.

Figure 9.
Average respiratory data before and after training in the control group.
Figure 9.
Average respiratory data before and after training in the control group.
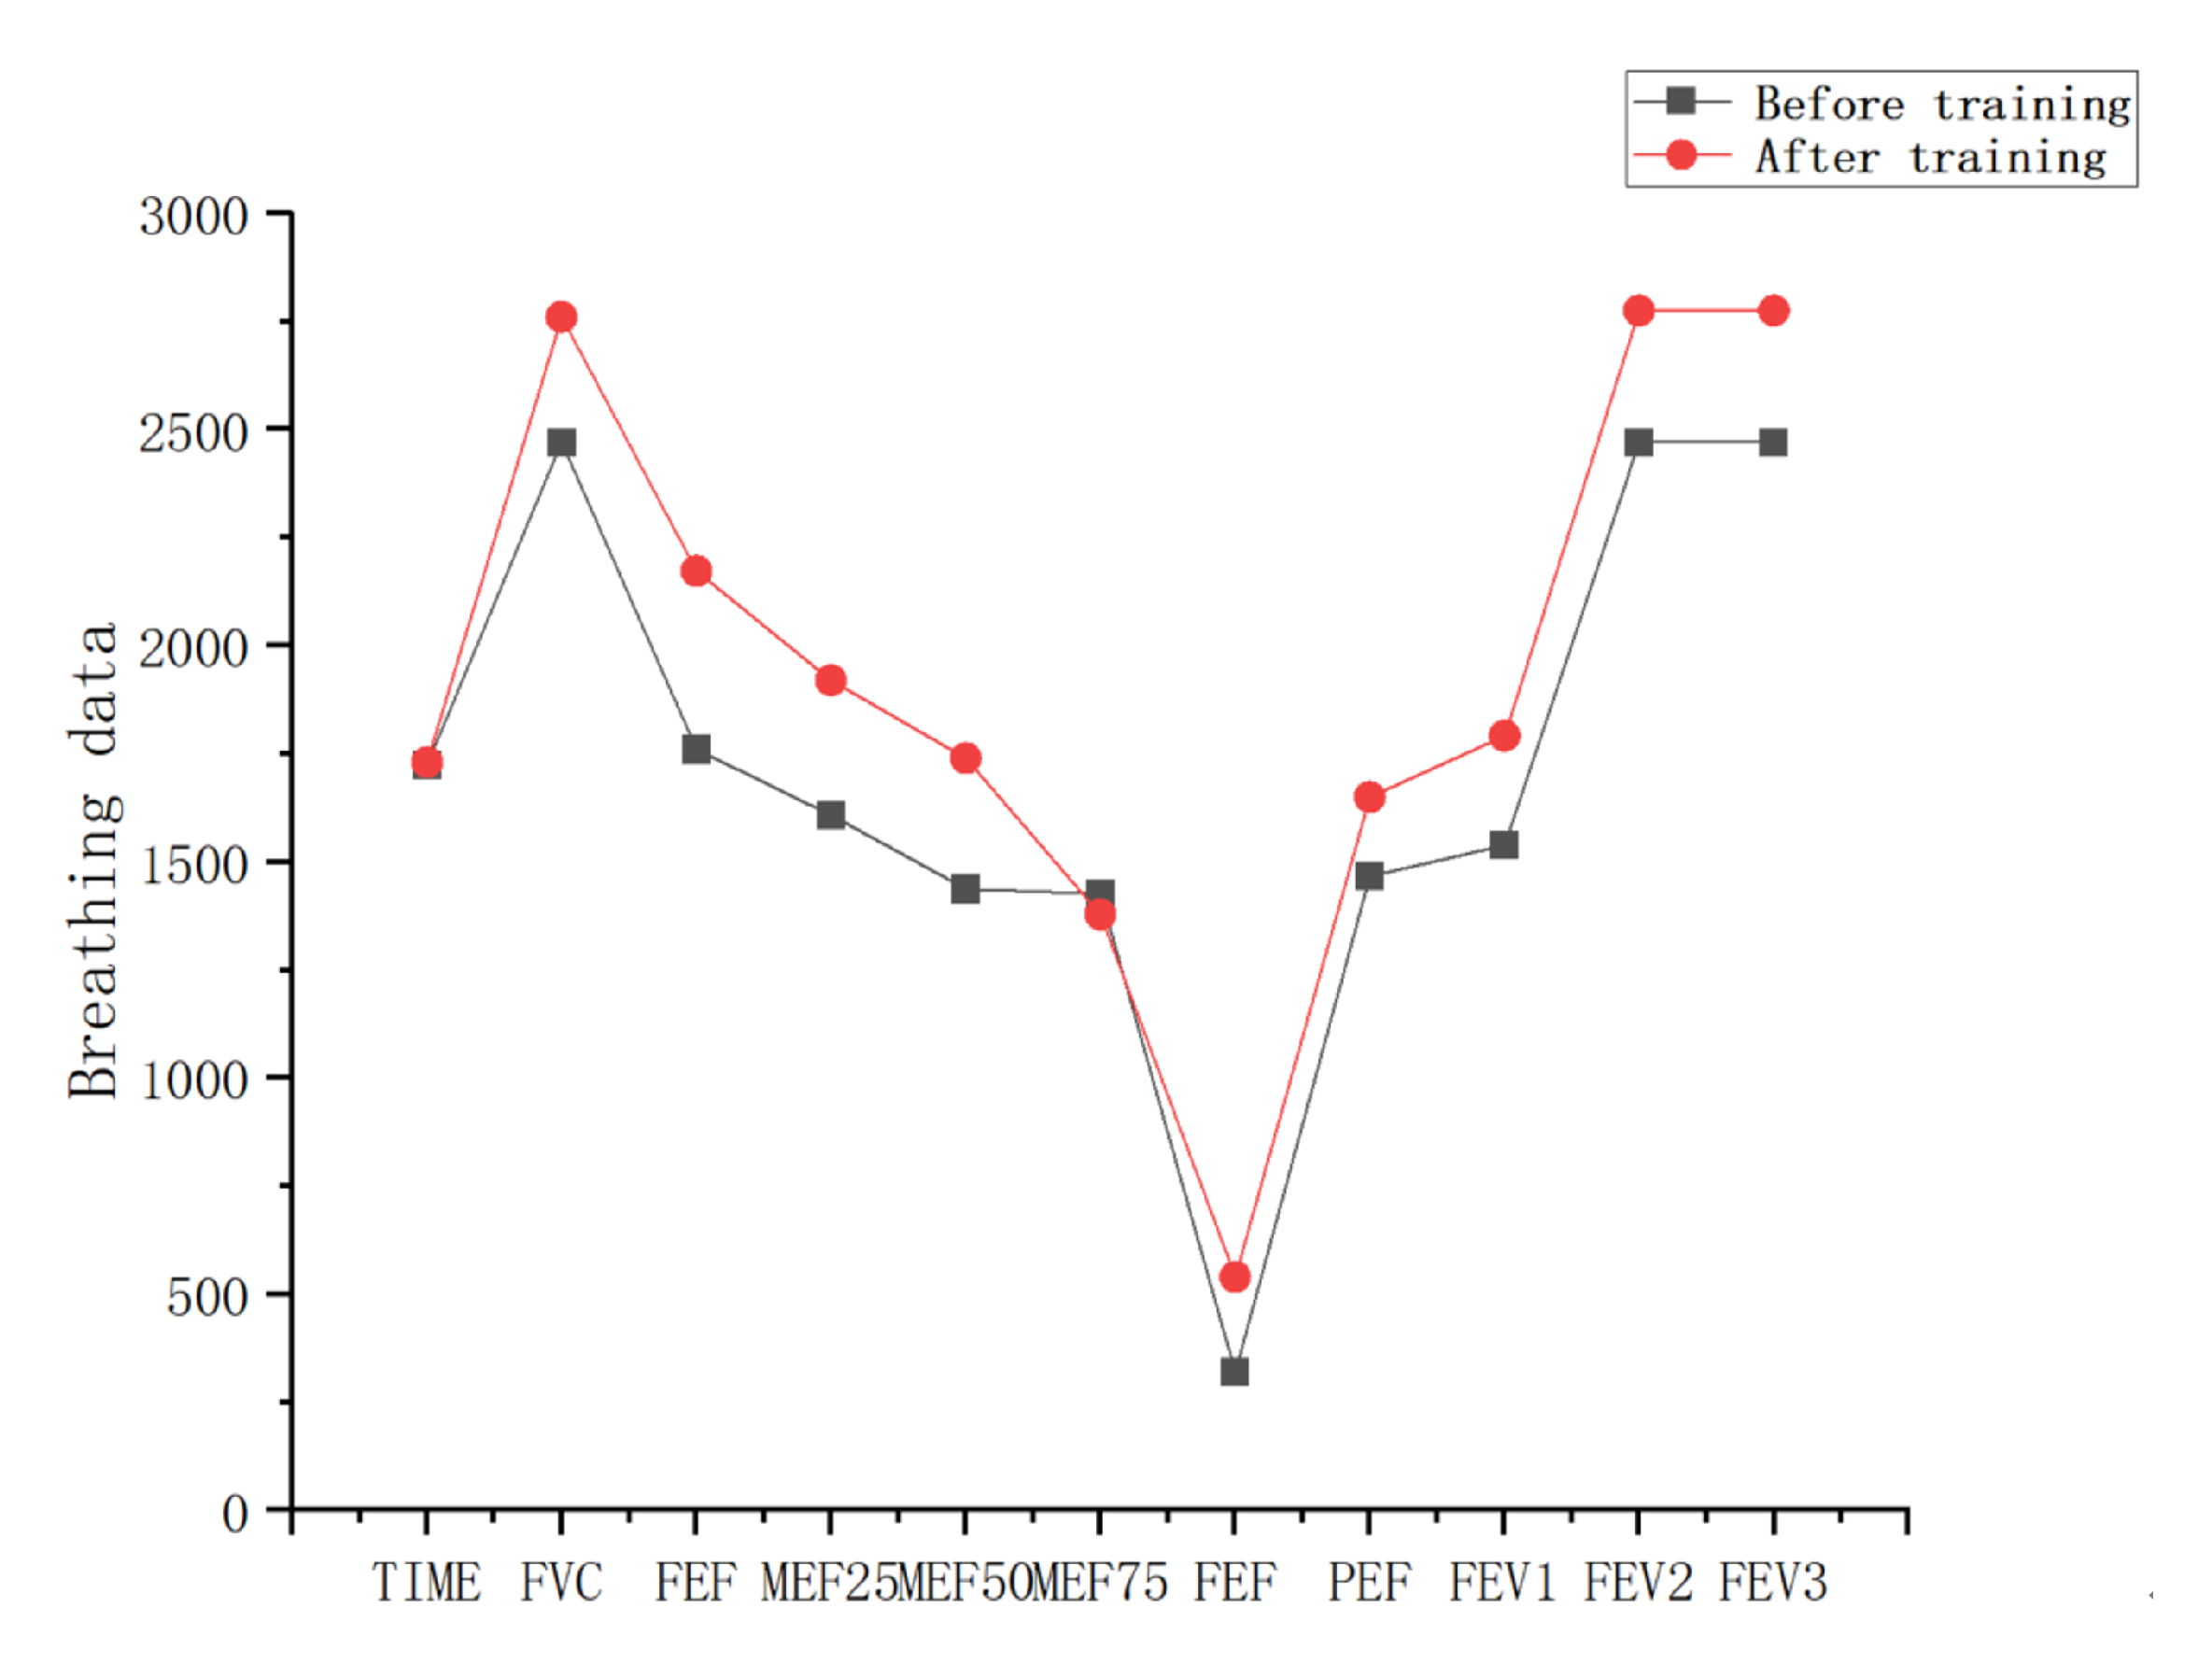
Figure 10.
Average vital capacity ratio before and after training in the control group.
Figure 10.
Average vital capacity ratio before and after training in the control group.
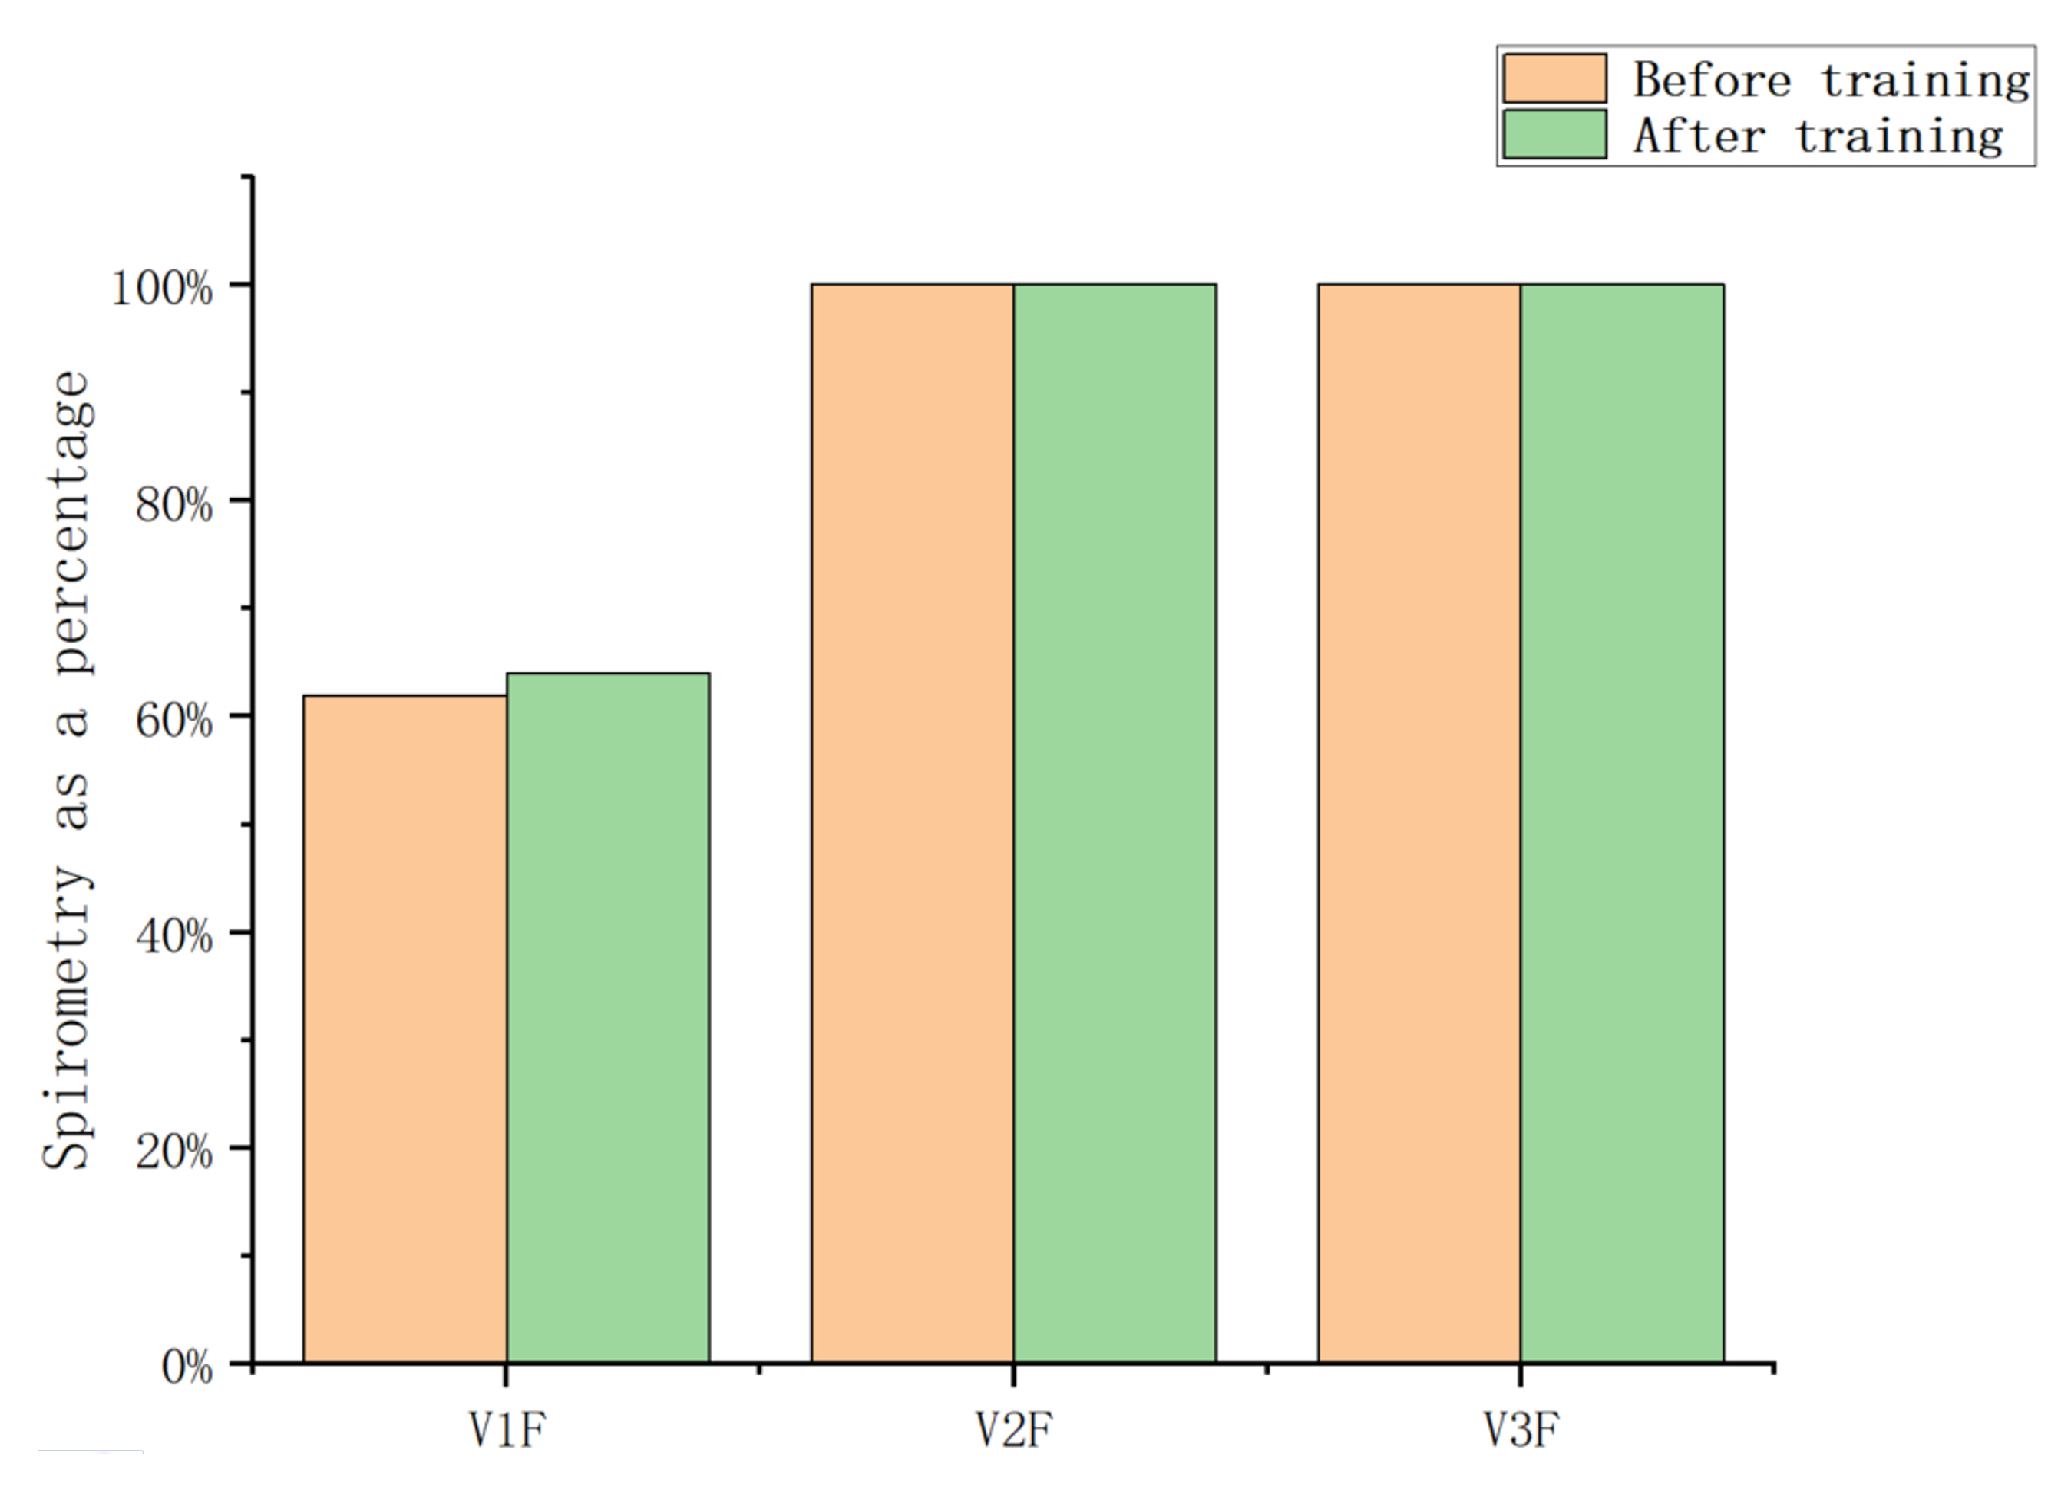
Figure 11.
Average respiratory data of the observation group before and after training.
Figure 11.
Average respiratory data of the observation group before and after training.
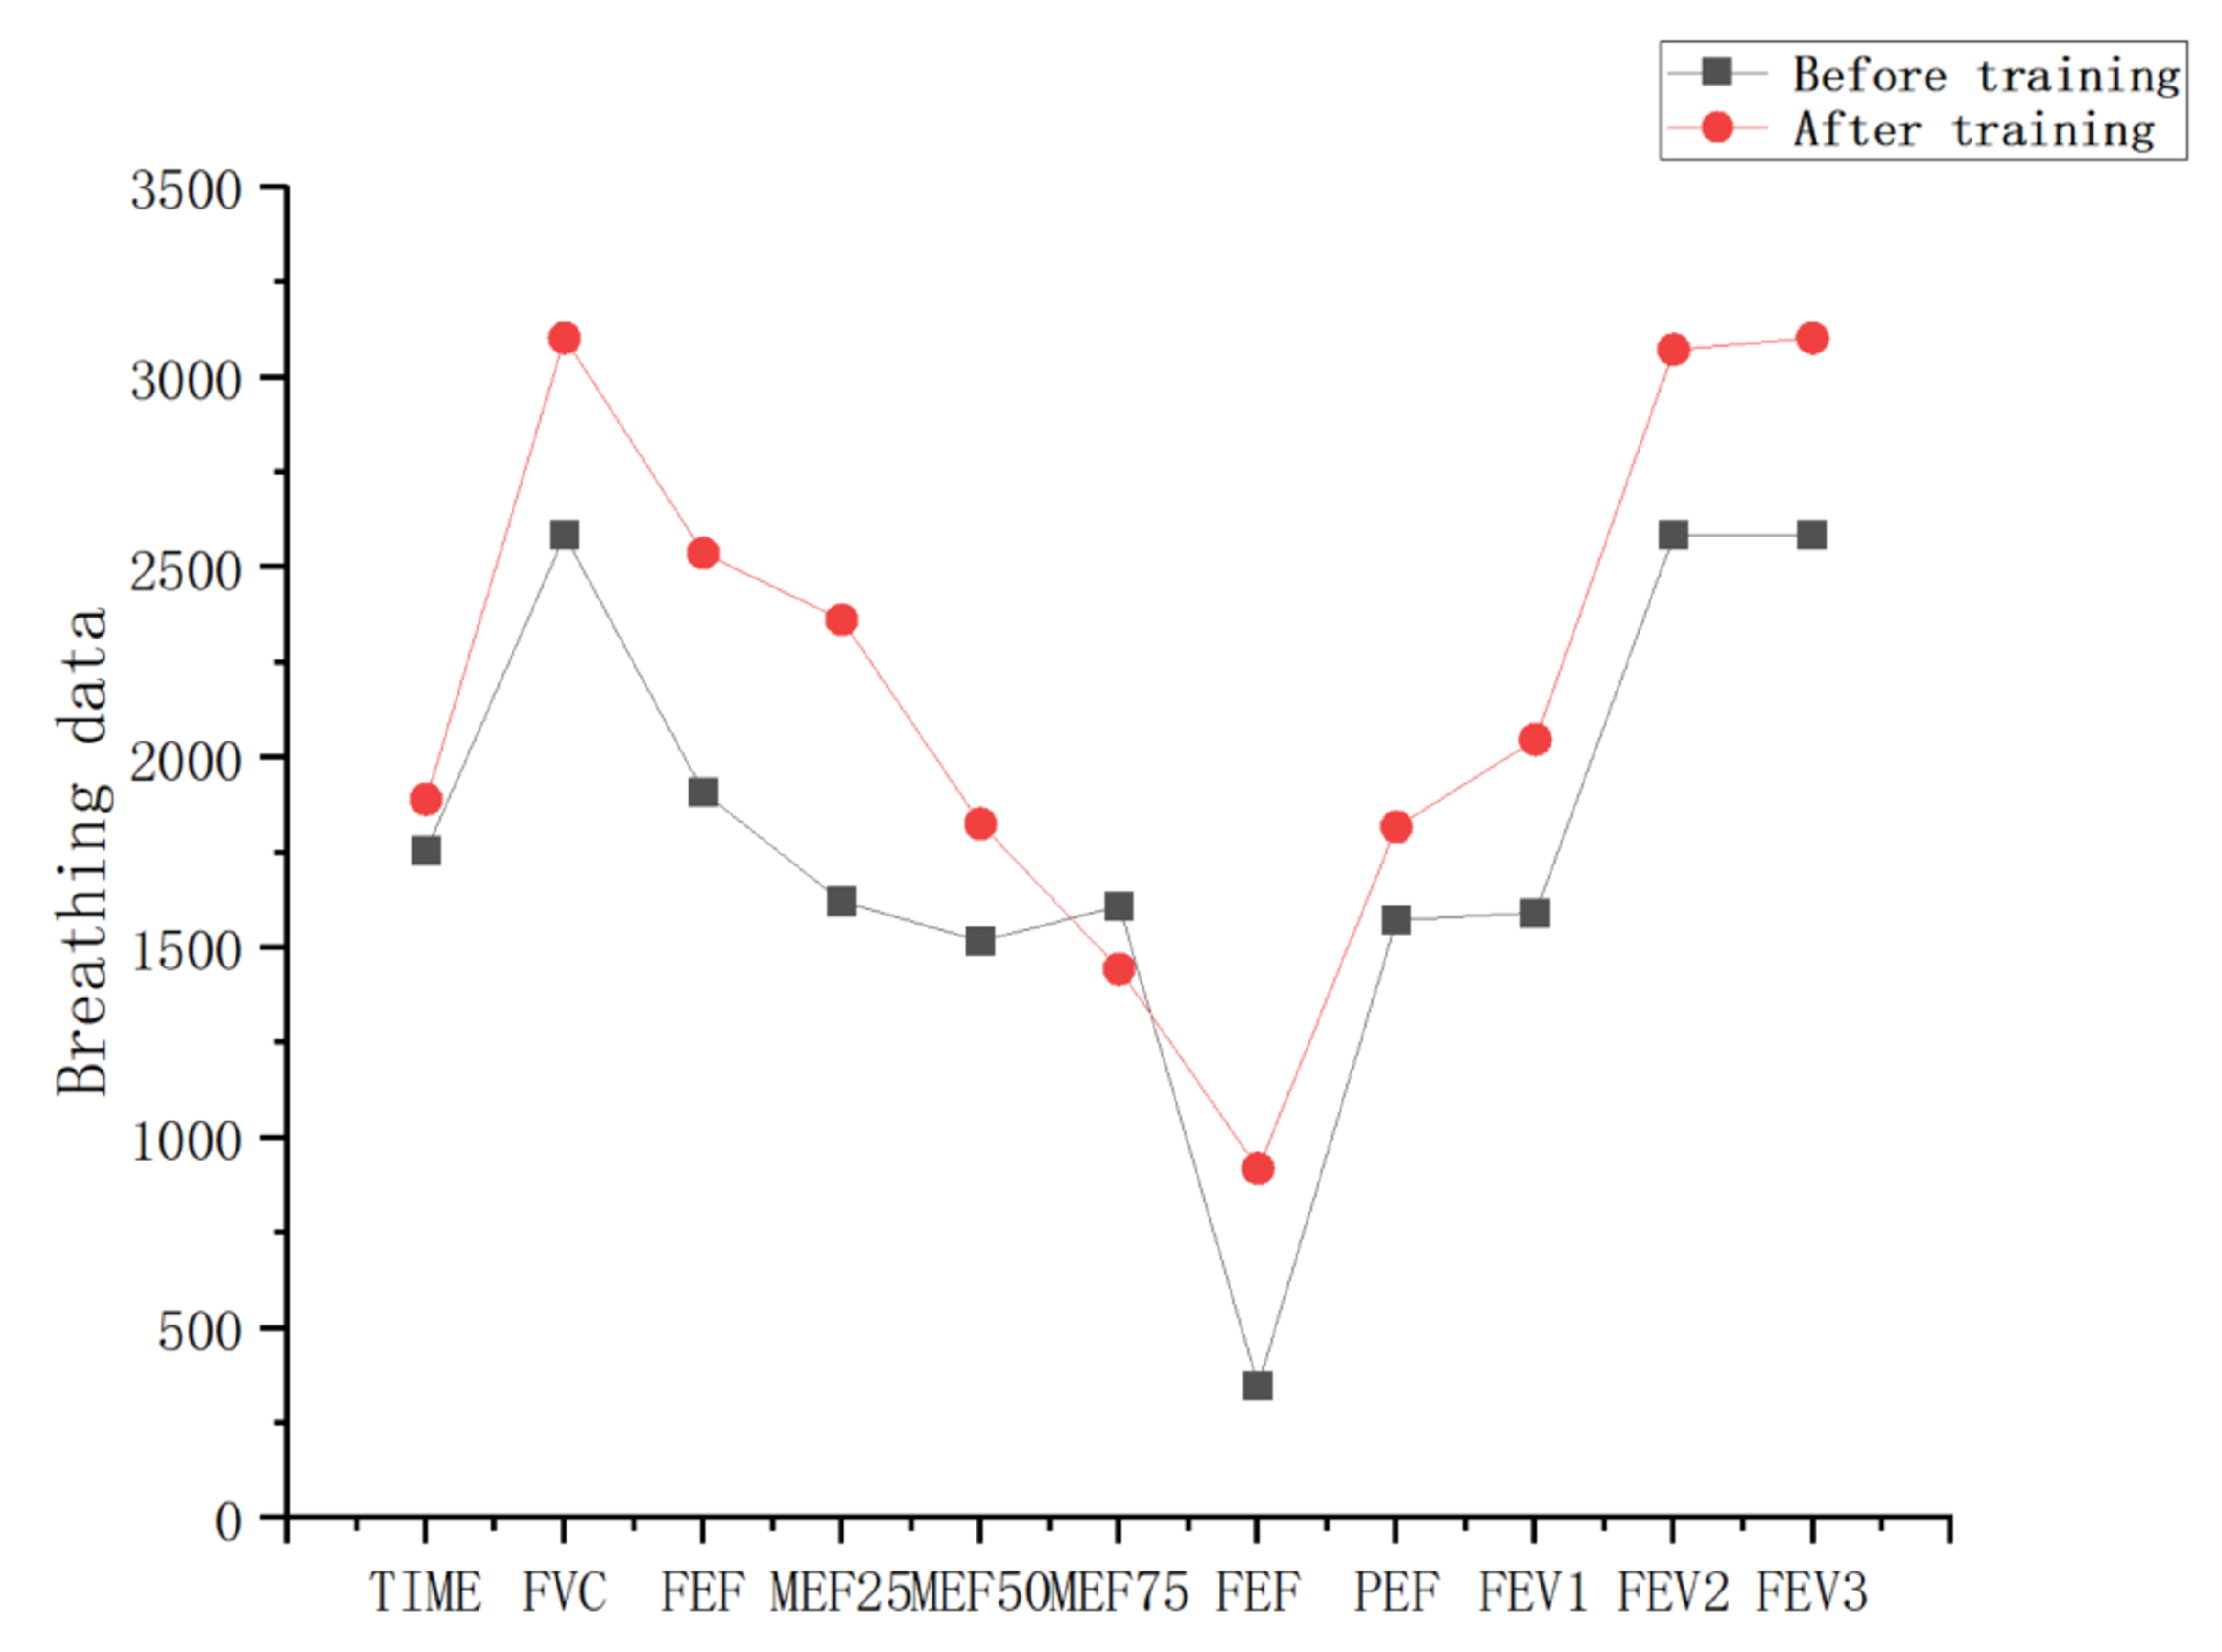
Figure 12.
The average vital capacity ratio of the observation group before and after training.
Figure 12.
The average vital capacity ratio of the observation group before and after training.
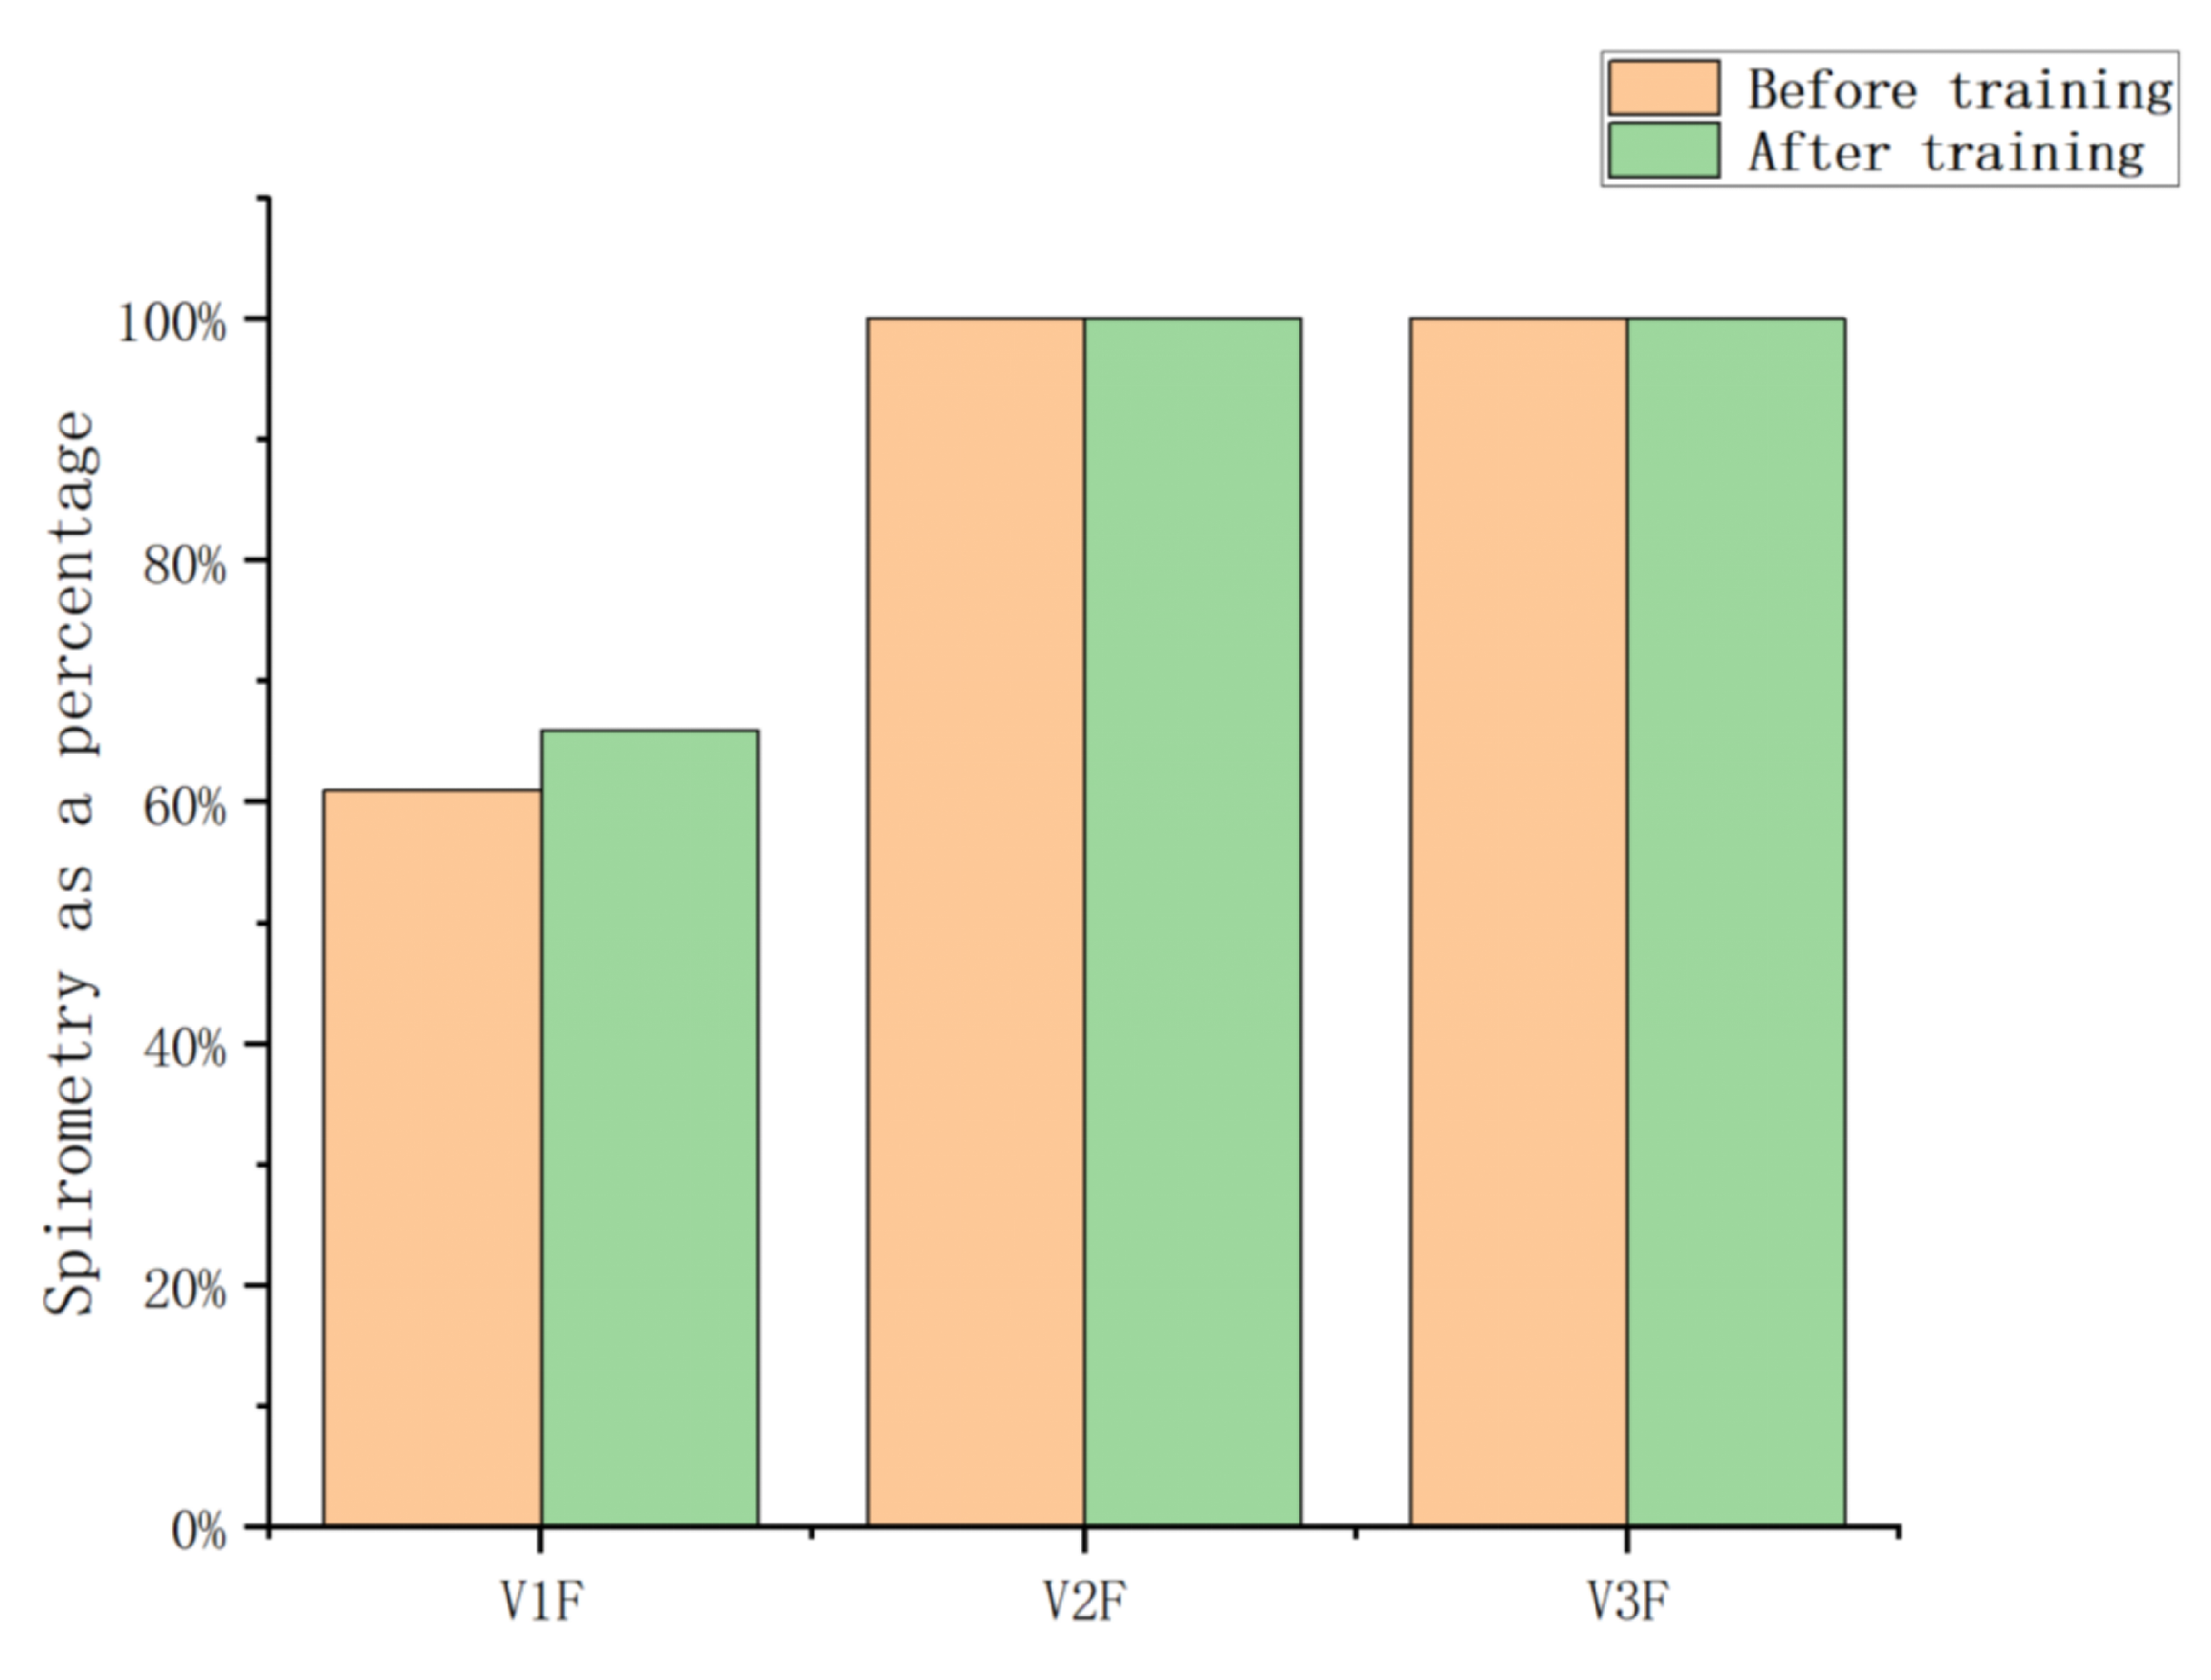
Figure 13.
Respiration data before and after training of the control group and observation group.
Figure 13.
Respiration data before and after training of the control group and observation group.
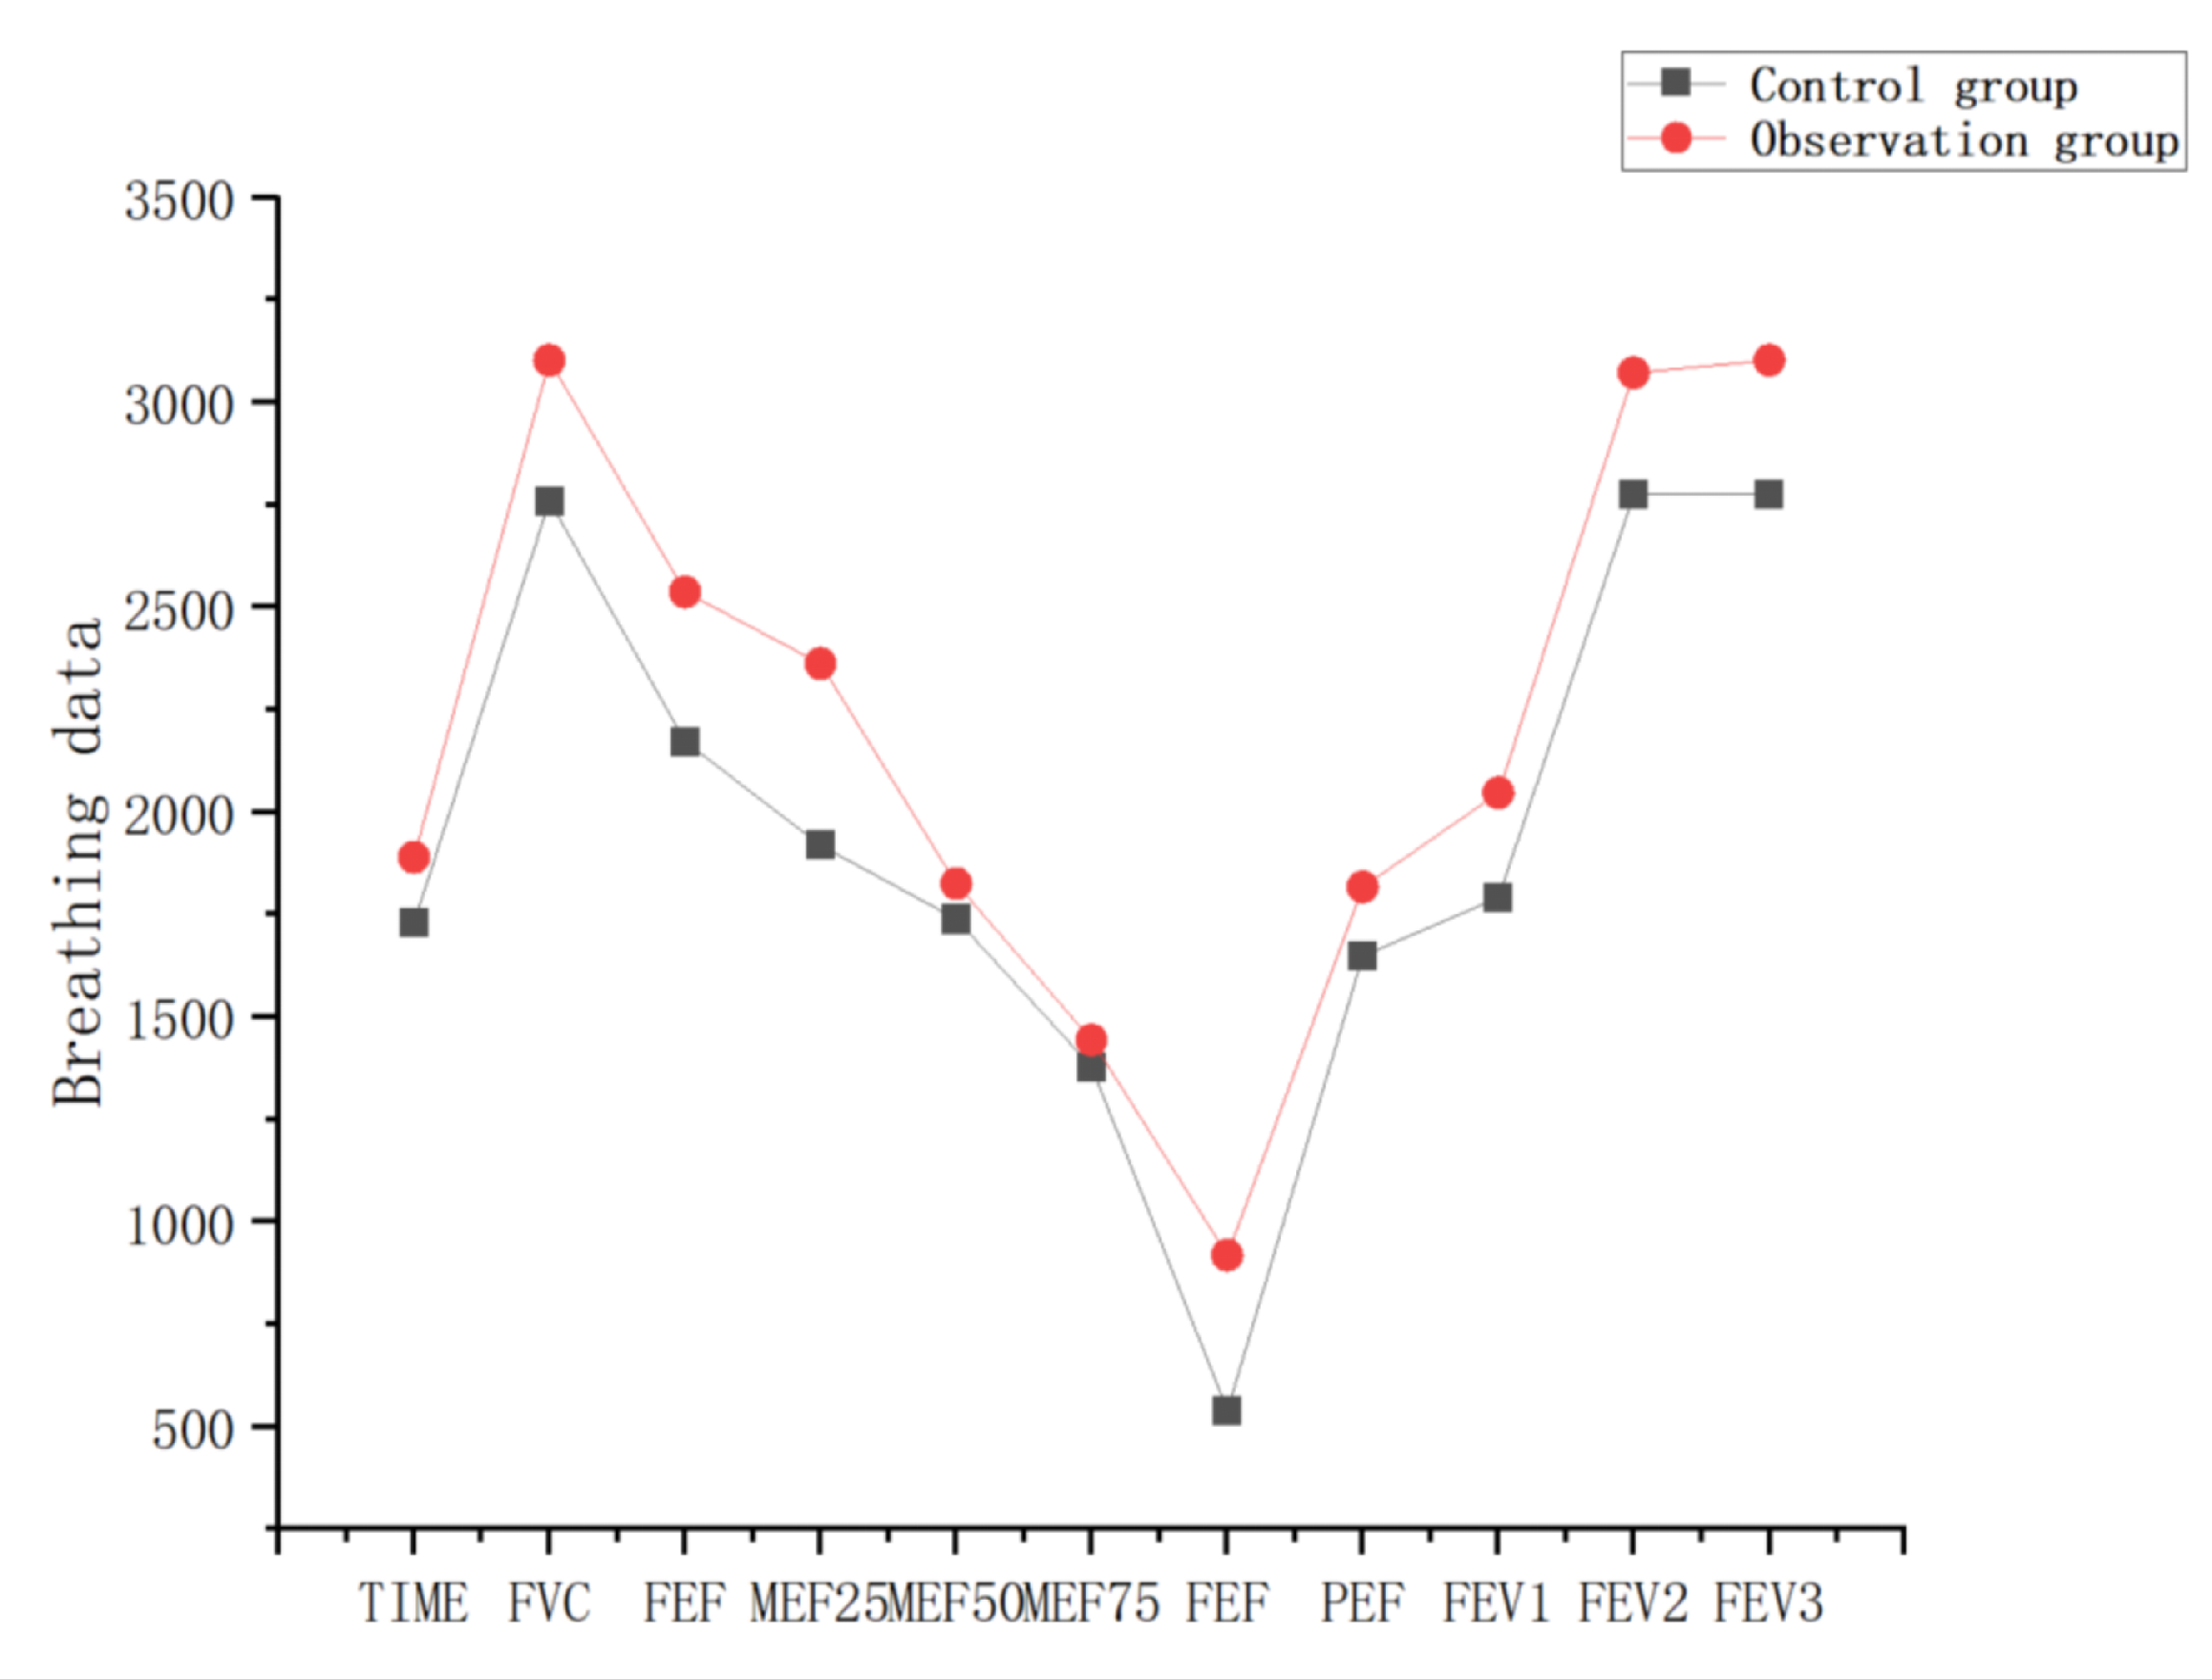
Figure 14.
The ratio of lung capacity before and after training in the control group and the observation group.
Figure 14.
The ratio of lung capacity before and after training in the control group and the observation group.
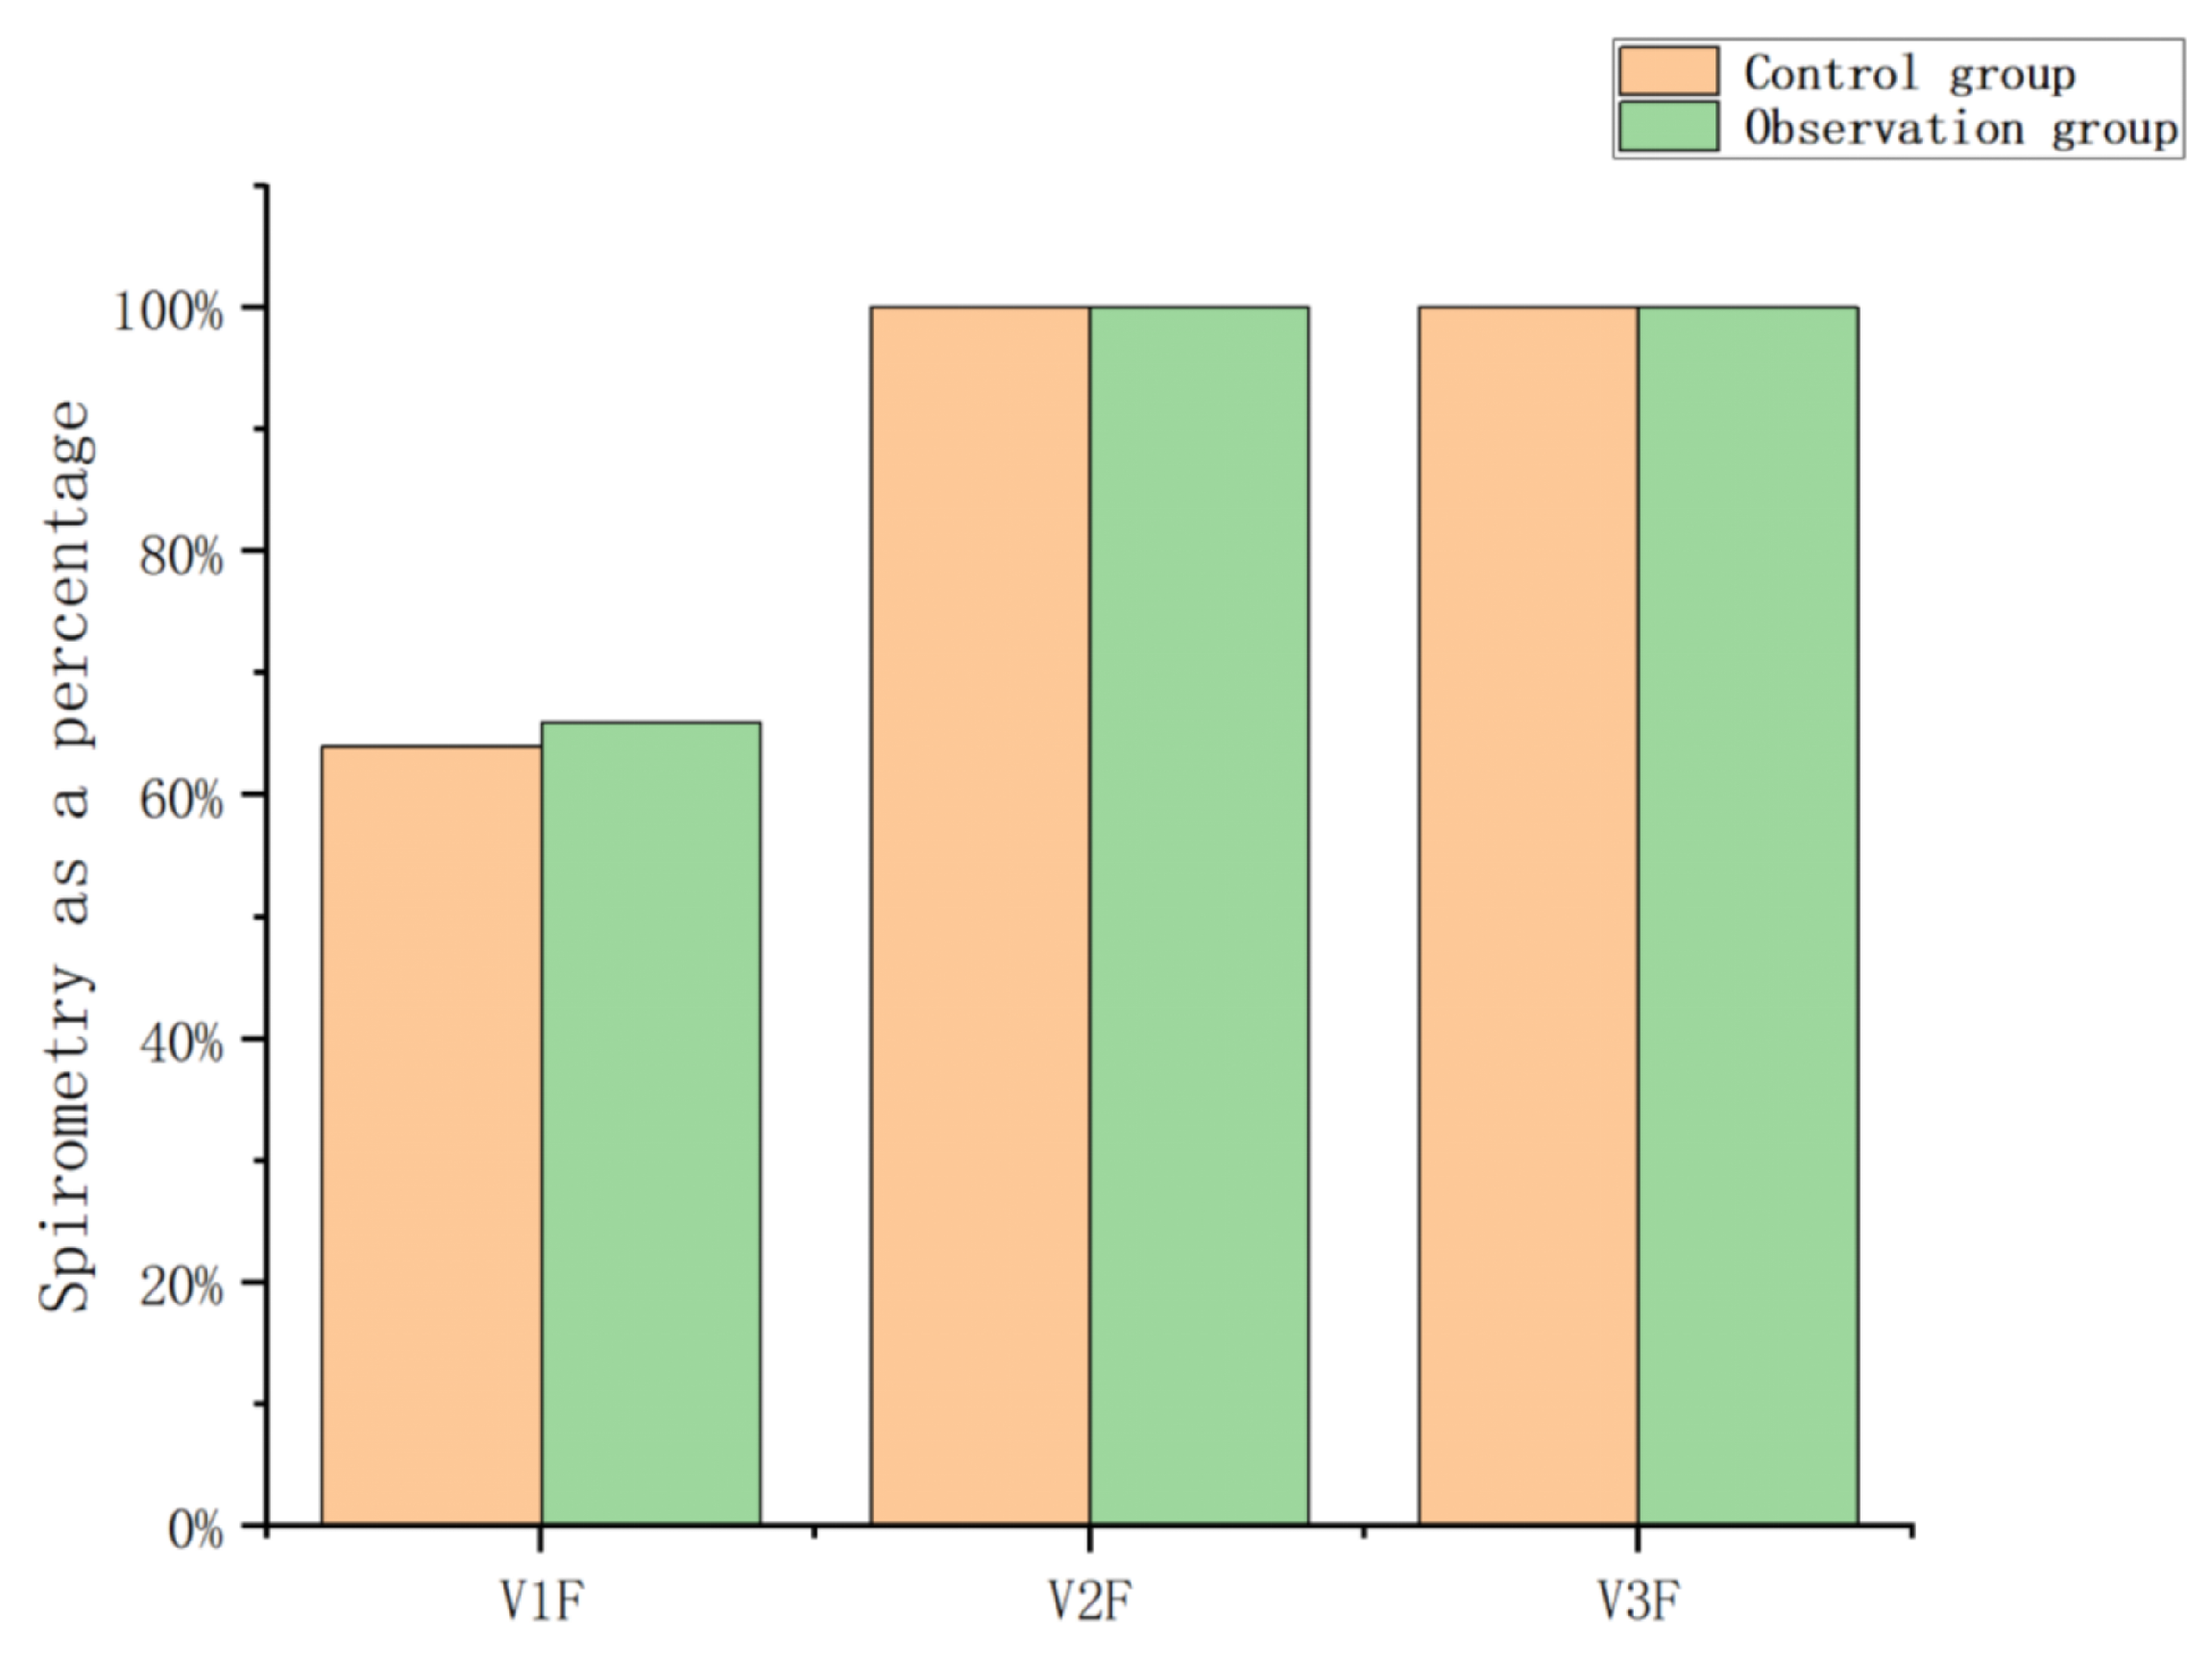
Figure 15.
Total score of boredom per week.
Figure 15.
Total score of boredom per week.
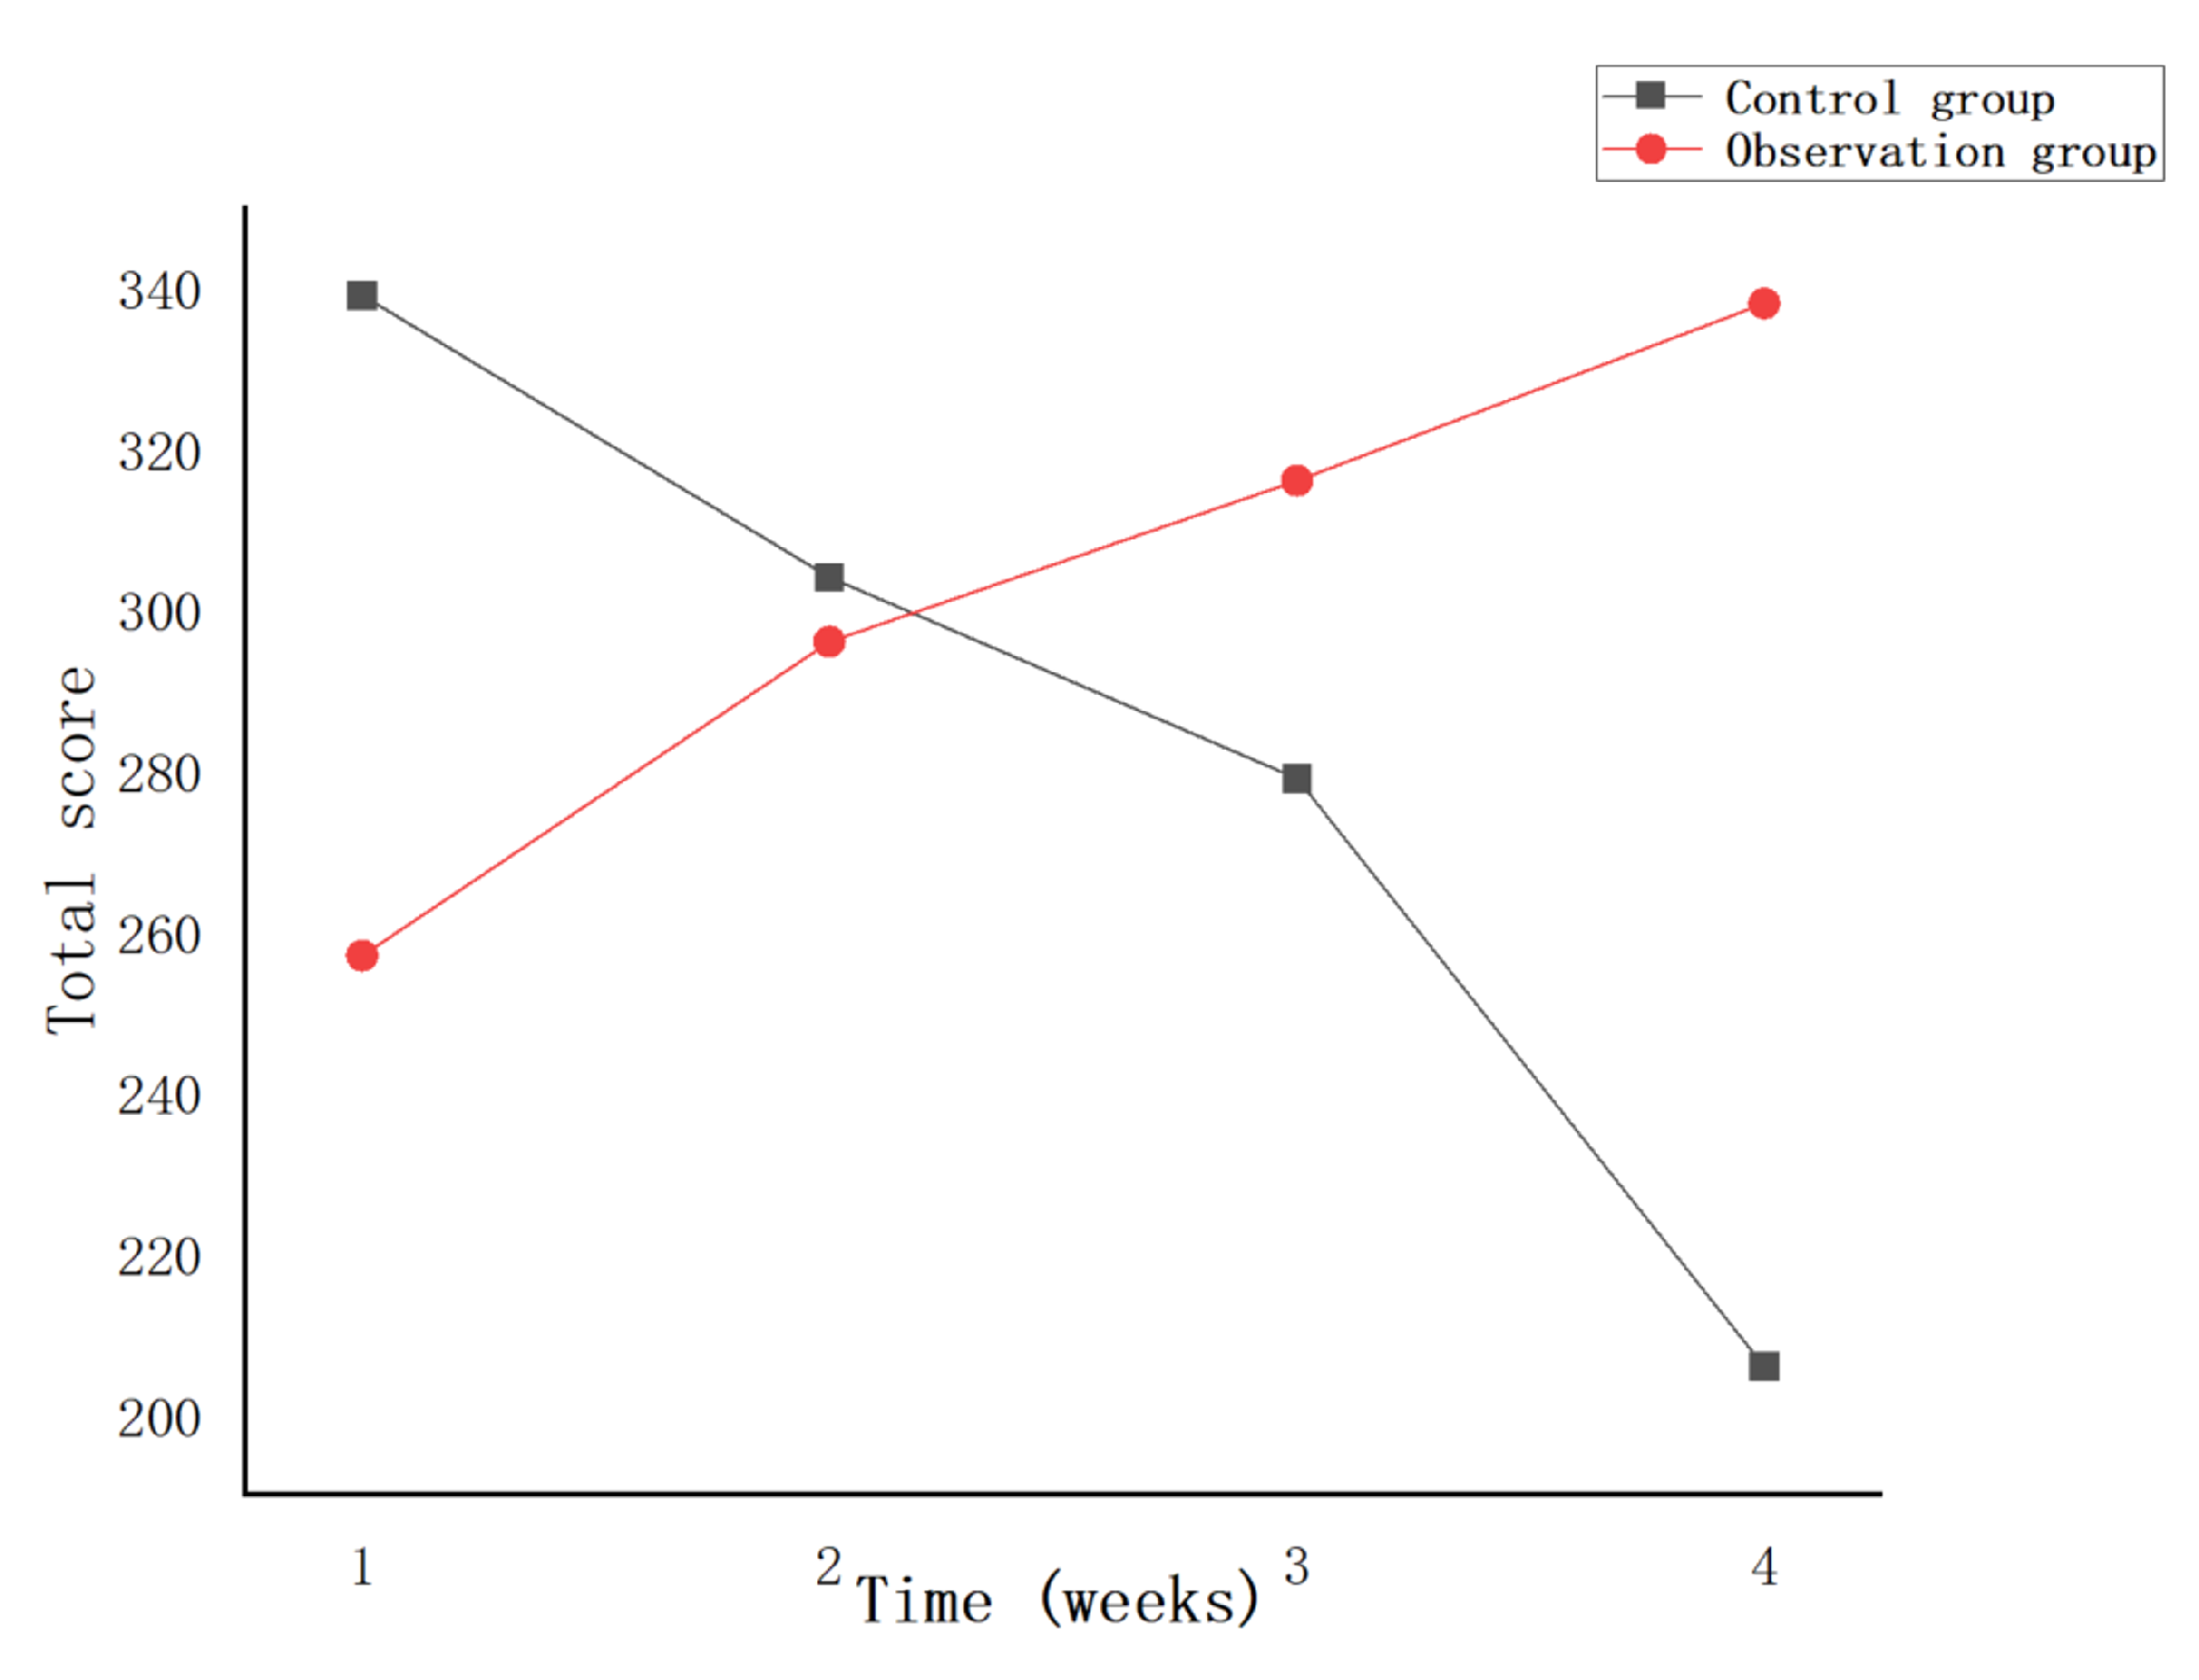
Figure 16.
Total Weekly Inattention Scores.
Figure 16.
Total Weekly Inattention Scores.

Figure 17.
Total score for failing to keep up with the rhythm every week.
Figure 17.
Total score for failing to keep up with the rhythm every week.
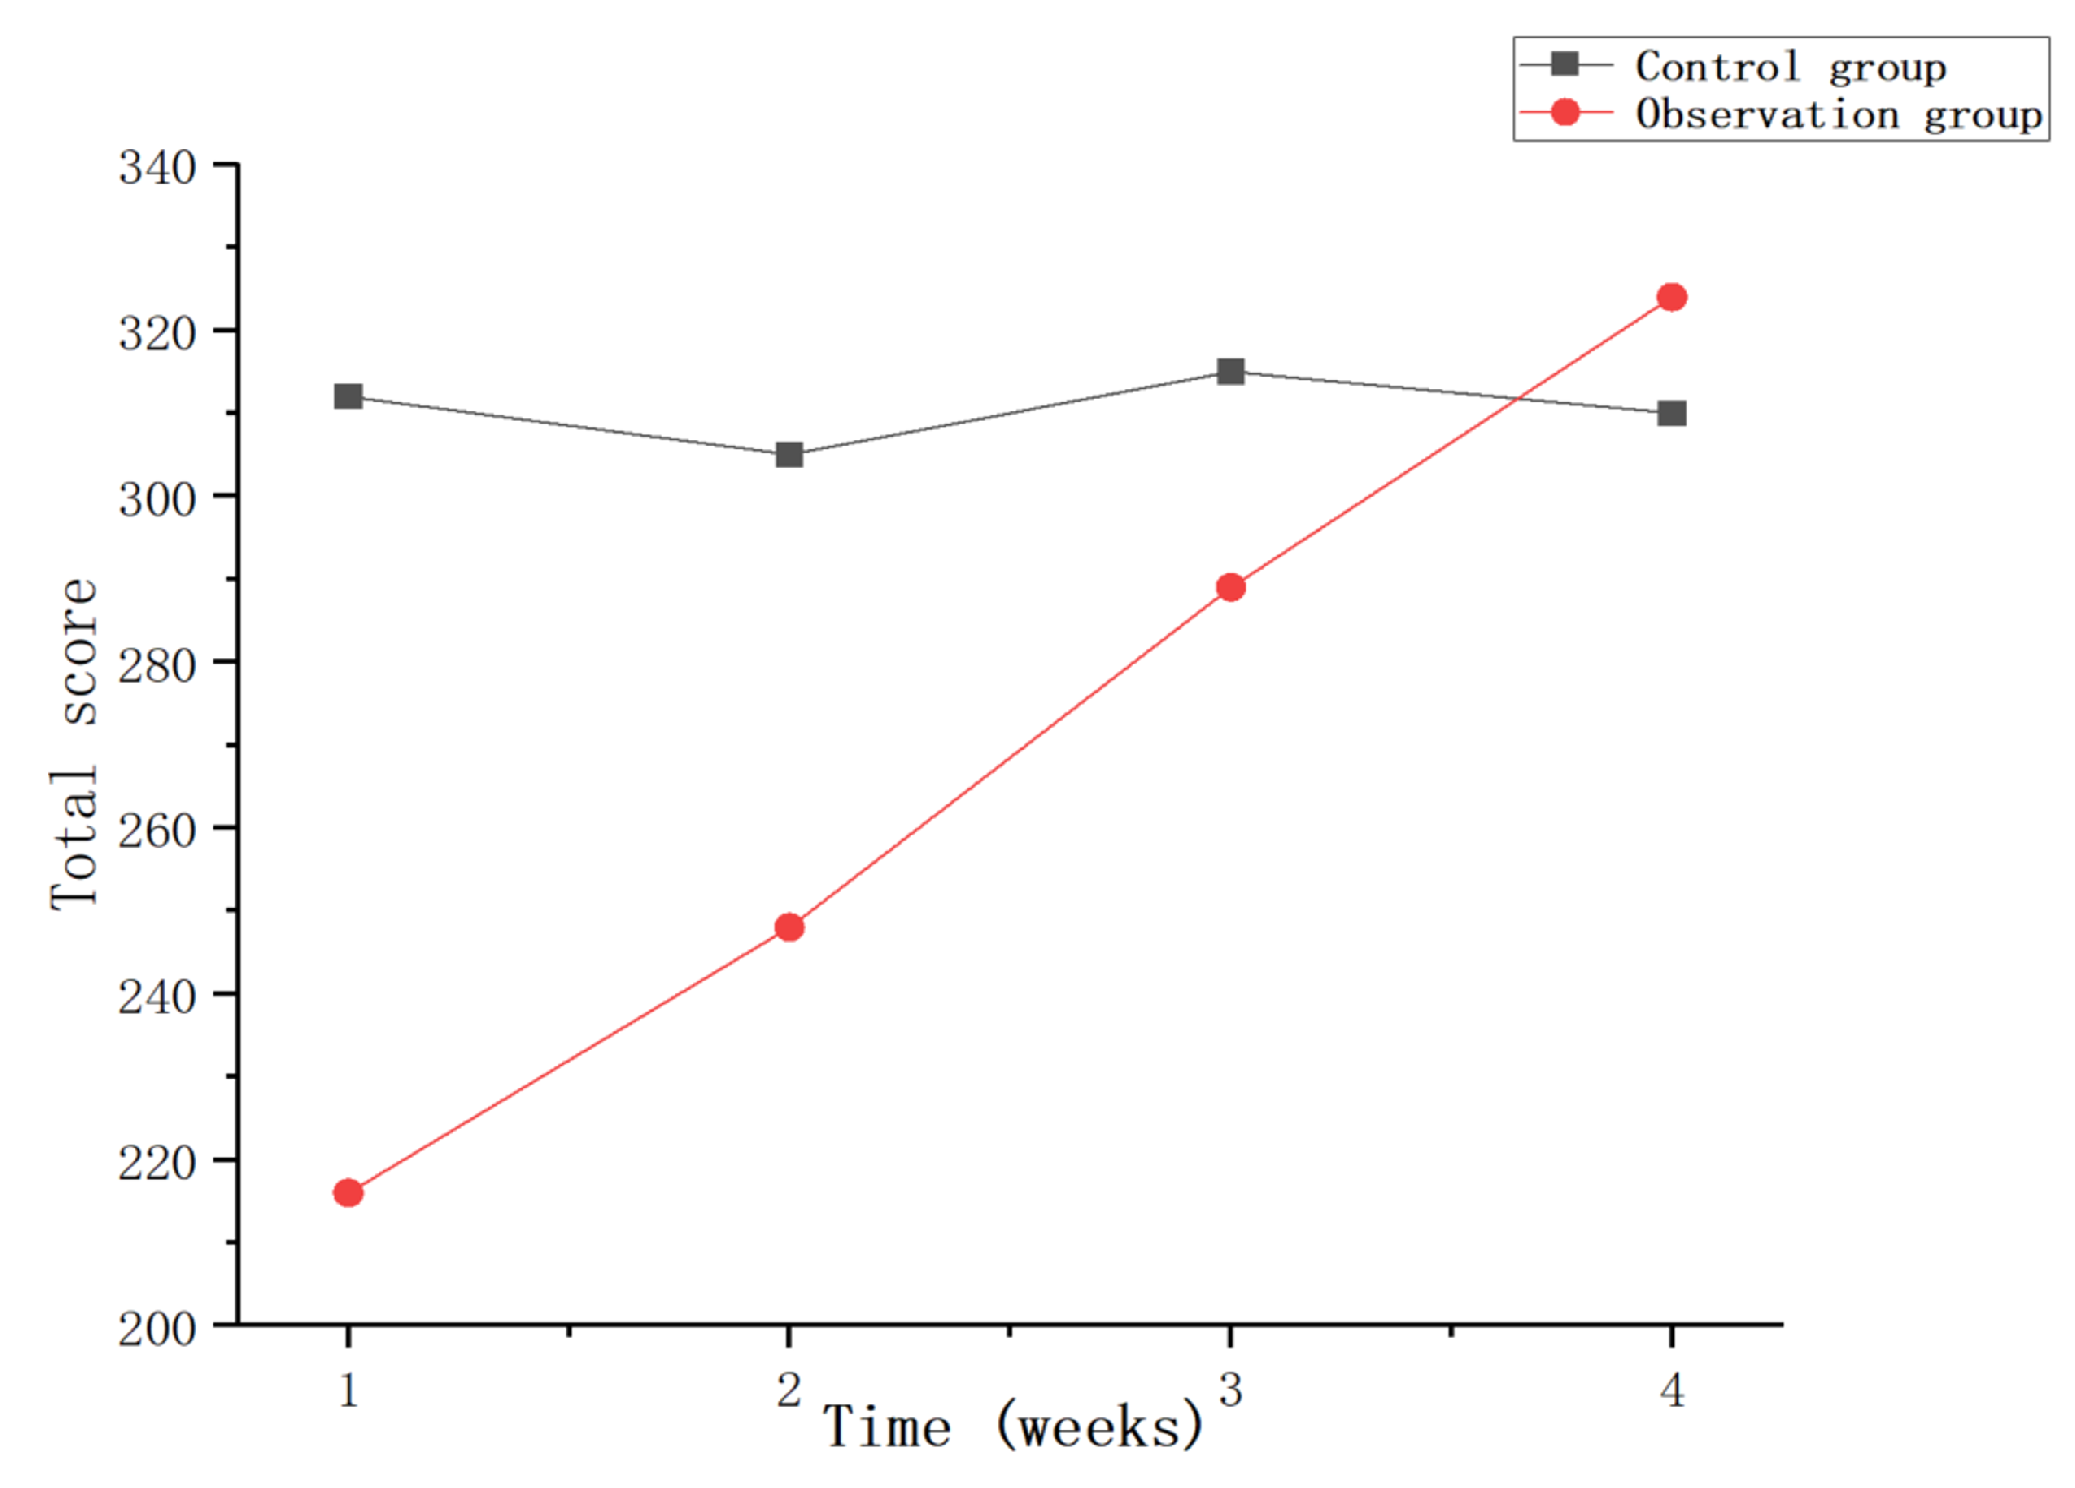
Table 1.
Twenty-five respiratory data type bytes.
Table 1.
Twenty-five respiratory data type bytes.
| Byte Number | High and Low Byte Types | Respiration Data Type | |
|---|---|---|---|
| 0 | TIMEH Exhalation time high byte | Exhalation time | TIME |
| 1 | TIMEL Expiration time low byte | ||
| 2 | FVCH Vital Capacity FVC High Byte | Forced vital capacity | FVC |
| 3 | FVCL Vital Capacity FVC Low Byte | ||
| 4 | FEEH Peak flow rate high byte | Peak flow rate | FEF |
| 5 | FEEL Peak flow rate low byte | ||
| 6 | MEF25H Flow rate high byte | Flow rate at 25% vital capacity | MEF25 |
| 7 | MEF25L Flow rate low byte | ||
| 8 | MEF50H Flow rate high byte | Flow rate at 50% vital capacity | MEF25 |
| 9 | MEF50L Flow rate low byte | ||
| 10 | MEF75H Flow rate high byte | Flow rate at 75% vital capacity | MEF25 |
| 11 | MEF75L Flow rate low byte | ||
| 12 | FEF25-75H 25–75% flow rate difference high byte |
Exhalation time | FEF25-75 |
| 13 | FEF25-75L 25–75% flow rate difference low byte |
||
| 14 | PEF25-75H 25–75% average velocity high byte |
Average flow rate | PEF25-75 |
| 15 | PEF25-75L 25–75% average flow rate low byte |
||
| 16 | FEV1H Vital capacity high byte in the previous second |
Vital capacity in one second | FEV1 |
| 17 | FEV1L Vital capacity low byte in the previous second |
||
| 18 | FEV2H Vital capacity high byte in the first two seconds |
Two-second vital capacity | FEV2 |
| 19 | FEV2L Vital capacity low byte in the first two seconds |
||
| 20 | FEV3H Vital capacity high byte in the first three seconds |
Three-second vital capacity | FEV3 |
| 21 | FEV3L Vital capacity low byte in the first three seconds |
||
| 22 | V1F Vital capacity in one second as a percentage of FEV1/FVC |
Unit:% | |
| 23 | V2F Vital capacity in two seconds as a percentage of FEV2/FVC |
||
| 24 | V3F Three-second vital capacity as a percentage of FEV3/FVC |
||
Table 2.
Participant information.
Table 2.
Participant information.
| Participant ID | Gender | Age | Other Medical History | Tolerance | V1F |
|---|---|---|---|---|---|
| 1 | Man | 60 | NO | Well | <70% |
| 2 | Woman | 63 | NO | Well | <70% |
| 3 | Woman | 64 | NO | Well | <70% |
| 4 | Man | 59 | NO | Well | <70% |
| 5 | Man | 57 | NO | Well | <70% |
| 6 | Man | 64 | NO | Well | <70% |
| 7 | Man | 65 | NO | Well | <70% |
| 8 | Woman | 56 | NO | Well | <70% |
| 9 | Woman | 62 | NO | Well | <70% |
| 10 | Man | 58 | NO | Well | <70% |
Table 3.
Experimental Training Feeling Scale.
Table 3.
Experimental Training Feeling Scale.
| Serial Number | Question | Very Much Agree | Agree | General | Disagree | Strongly Disagree |
|---|---|---|---|---|---|---|
| 1 | During training, do you feel bored? | 1 | 2 | 3 | 4 | 5 |
| 2 | During training, are you distracted and unable to concentrate? | 1 | 2 | 3 | 4 | 5 |
| 3 | During training, are you unable to keep up with the training pace? | 1 | 2 | 3 | 4 | 5 |
Table 4.
The breathing data of the participants in the control group before training.
Table 4.
The breathing data of the participants in the control group before training.
| ID | TIME | FVC | FEF | MEF25 | MEF50 | MEF75 | FEF | PEF | FEV1 | FEV2 | FEV3 | V1F | V2F | V3F |
|---|---|---|---|---|---|---|---|---|---|---|---|---|---|---|
| (ms) | (mL) | (mL/s) | (mL/s) | (mL/s) | (mL/s) | (mL/s) | (mL/s) | (mL) | (mL) | (mL) | (%) | (%) | (%) | |
| 1 | 1810 | 2311 | 1529 | 1297 | 1161 | 1487 | 190 | 1298 | 1244 | 2311 | 2311 | 53 | 100 | 100 |
| 2 | 1910 | 2497 | 1615 | 1601 | 1399 | 1001 | 600 | 1314 | 1494 | 2497 | 2497 | 59 | 100 | 100 |
| 3 | 1690 | 2689 | 1860 | 1729 | 1614 | 1605 | 124 | 1680 | 1700 | 2689 | 2689 | 63 | 100 | 100 |
| 4 | 1590 | 2420 | 1909 | 1667 | 1432 | 1274 | 393 | 1440 | 1585 | 2420 | 2420 | 65 | 100 | 100 |
| 5 | 1620 | 2431 | 1883 | 1747 | 1578 | 1757 | 290 | 1599 | 1668 | 2431 | 2431 | 68 | 100 | 100 |
| AVG | 1724 | 2470 | 1760 | 1609 | 1437 | 1425 | 319 | 1466 | 1538 | 2470 | 2470 | 62 | 100 | 100 |
Table 5.
Breathing data of participants in the control group after training.
Table 5.
Breathing data of participants in the control group after training.
| ID | TIME | FVC | FEF | MEF25 | MEF50 | MEF75 | FEF | PEF | FEV1 | FEV2 | FEV3 | V1F | V2F | V3F |
|---|---|---|---|---|---|---|---|---|---|---|---|---|---|---|
| (ms) | (mL) | (mL/s) | (mL/s) | (mL/s) | (mL/s) | (mL/s) | (mL/s) | (mL) | (mL) | (mL) | (%) | (%) | (%) | |
| 1 | 1870 | 2719 | 1980 | 1652 | 1372 | 1312 | 340 | 1373 | 1555 | 2791 | 2791 | 57 | 100 | 100 |
| 2 | 1790 | 2686 | 2247 | 1825 | 1599 | 1244 | 581 | 1444 | 1688 | 2686 | 2686 | 62 | 100 | 100 |
| 3 | 1730 | 2582 | 1862 | 1712 | 1544 | 1355 | 357 | 1555 | 1649 | 2582 | 2582 | 63 | 100 | 100 |
| 4 | 1620 | 3379 | 2653 | 2396 | 2537 | 1646 | 750 | 2252 | 2341 | 3379 | 3379 | 69 | 100 | 100 |
| 5 | 1640 | 2432 | 2118 | 2010 | 1642 | 1335 | 675 | 1621 | 1724 | 2432 | 2432 | 70 | 100 | 100 |
| AVG | 1730 | 2760 | 2172 | 1919 | 1739 | 1378 | 540 | 1649 | 1791 | 2774 | 2774 | 64 | 100 | 100 |
Table 6.
Respiration data of participants in the observation group before training.
Table 6.
Respiration data of participants in the observation group before training.
| ID | TIME | FVC | FEF | MEF25 | MEF50 | MEF75 | FEF | PEF | FEV1 | FEV2 | FEV3 | V1F | V2F | V3F |
|---|---|---|---|---|---|---|---|---|---|---|---|---|---|---|
| (ms) | (mL) | (mL/s) | (mL/s) | (mL/s) | (mL/s) | (mL/s) | (mL/s) | (mL) | (mL) | (mL) | (%) | (%) | (%) | |
| 6 | 1640 | 2543 | 1771 | 1708 | 1614 | 1489 | 219 | 1609 | 1665 | 2543 | 2543 | 65 | 100 | 100 |
| 7 | 1970 | 2393 | 1544 | 1410 | 1223 | 1078 | 332 | 1208 | 1360 | 2393 | 2393 | 56 | 100 | 100 |
| 8 | 1590 | 2908 | 2634 | 1941 | 1710 | 2634 | 639 | 1964 | 1870 | 2908 | 2908 | 64 | 100 | 100 |
| 9 | 1740 | 2833 | 1975 | 1539 | 1901 | 1716 | 177 | 1839 | 1685 | 2833 | 2833 | 59 | 100 | 100 |
| 10 | 1840 | 2244 | 1614 | 1509 | 1138 | 1129 | 380 | 1246 | 1381 | 2244 | 2244 | 61 | 100 | 100 |
| AVG | 1756 | 2584 | 1908 | 1621 | 1517 | 1609 | 349 | 1573 | 1592 | 2584 | 2584 | 61 | 100 | 100 |
Table 7.
Respiration data of participants in the observation group after training.
Table 7.
Respiration data of participants in the observation group after training.
| ID | TIME | FVC | FEF | MEF25 | MEF50 | MEF75 | FEF | PEF | FEV1 | FEV2 | FEV3 | V1F | V2F | V3F |
|---|---|---|---|---|---|---|---|---|---|---|---|---|---|---|
| (ms) | (mL) | (mL/s) | (mL/s) | (mL/s) | (mL/s) | (mL/s) | (mL/s) | (mL) | (mL) | (mL) | (%) | (%) | (%) | |
| 6 | 1590 | 2777 | 2327 | 2291 | 1785 | 1735 | 556 | 1851 | 1957 | 2777 | 2777 | 70 | 100 | 100 |
| 7 | 2180 | 3471 | 2620 | 2461 | 1751 | 1287 | 1174 | 1770 | 2117 | 3418 | 3471 | 60 | 100 | 100 |
| 8 | 1820 | 2903 | 2226 | 2062 | 1786 | 1418 | 644 | 1748 | 1918 | 2903 | 2903 | 66 | 100 | 100 |
| 9 | 1990 | 3160 | 2497 | 2134 | 1779 | 1396 | 738 | 1736 | 1990 | 3160 | 3160 | 62 | 100 | 100 |
| 10 | 1870 | 3205 | 3013 | 2864 | 2025 | 1382 | 1482 | 1978 | 2251 | 3205 | 3205 | 70 | 100 | 100 |
| AVG | 1890 | 3103 | 2537 | 2362 | 1825 | 1444 | 919 | 1817 | 2047 | 3072 | 3103 | 66 | 100 | 100 |
|
Disclaimer/Publisher’s Note: The statements, opinions and data contained in all publications are solely those of the individual author(s) and contributor(s) and not of MDPI and/or the editor(s). MDPI and/or the editor(s) disclaim responsibility for any injury to people or property resulting from any ideas, methods, instructions or products referred to in the content. |